Accenture plc's management explains the business in its own materials. The slides below do the most of that work, pulled from the documents preserved in Sources. Each source link opens the complete presentation at that slide in a new tab.
The newest deck: current results plus the freshest strategy — cybersecurity scale, the OT-security push and the new mid-market Edge unit. · Open the full document →
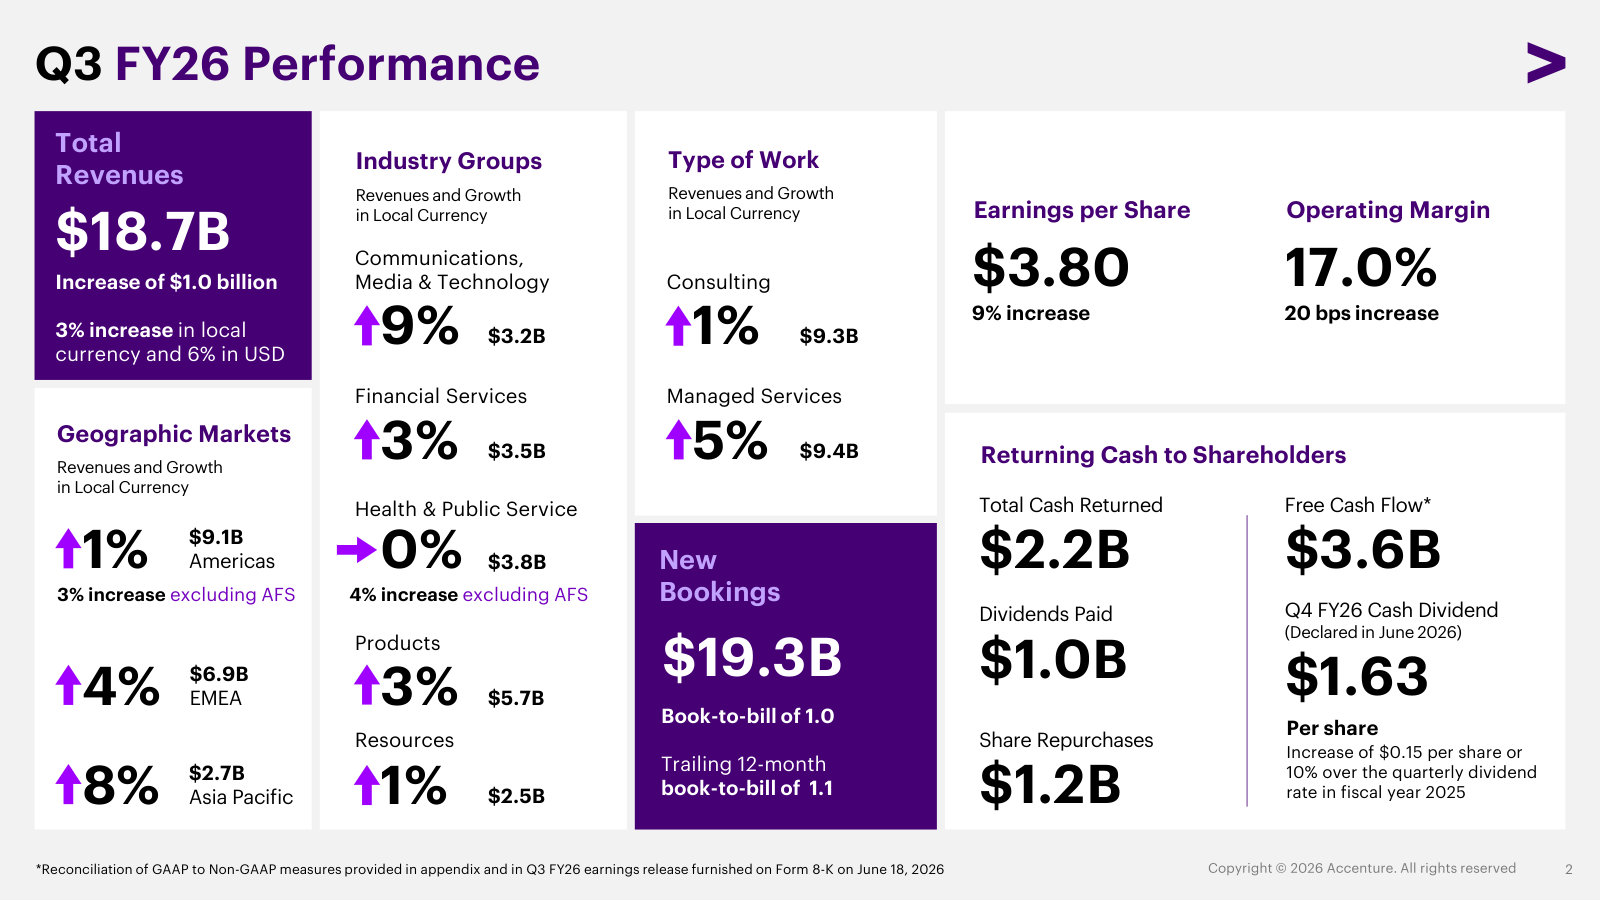
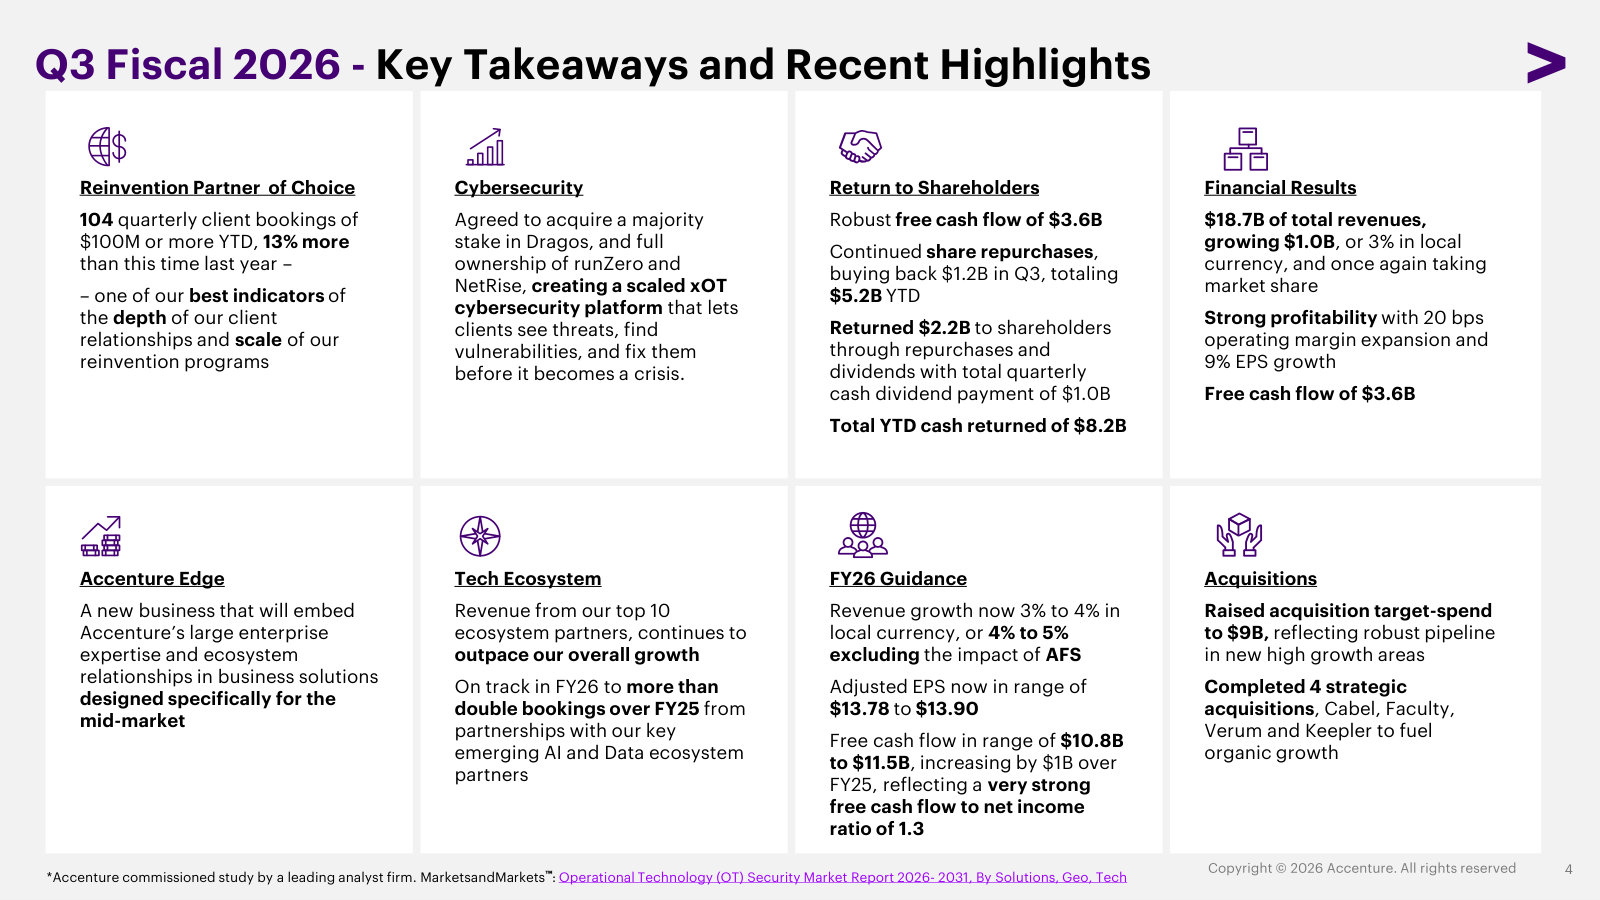
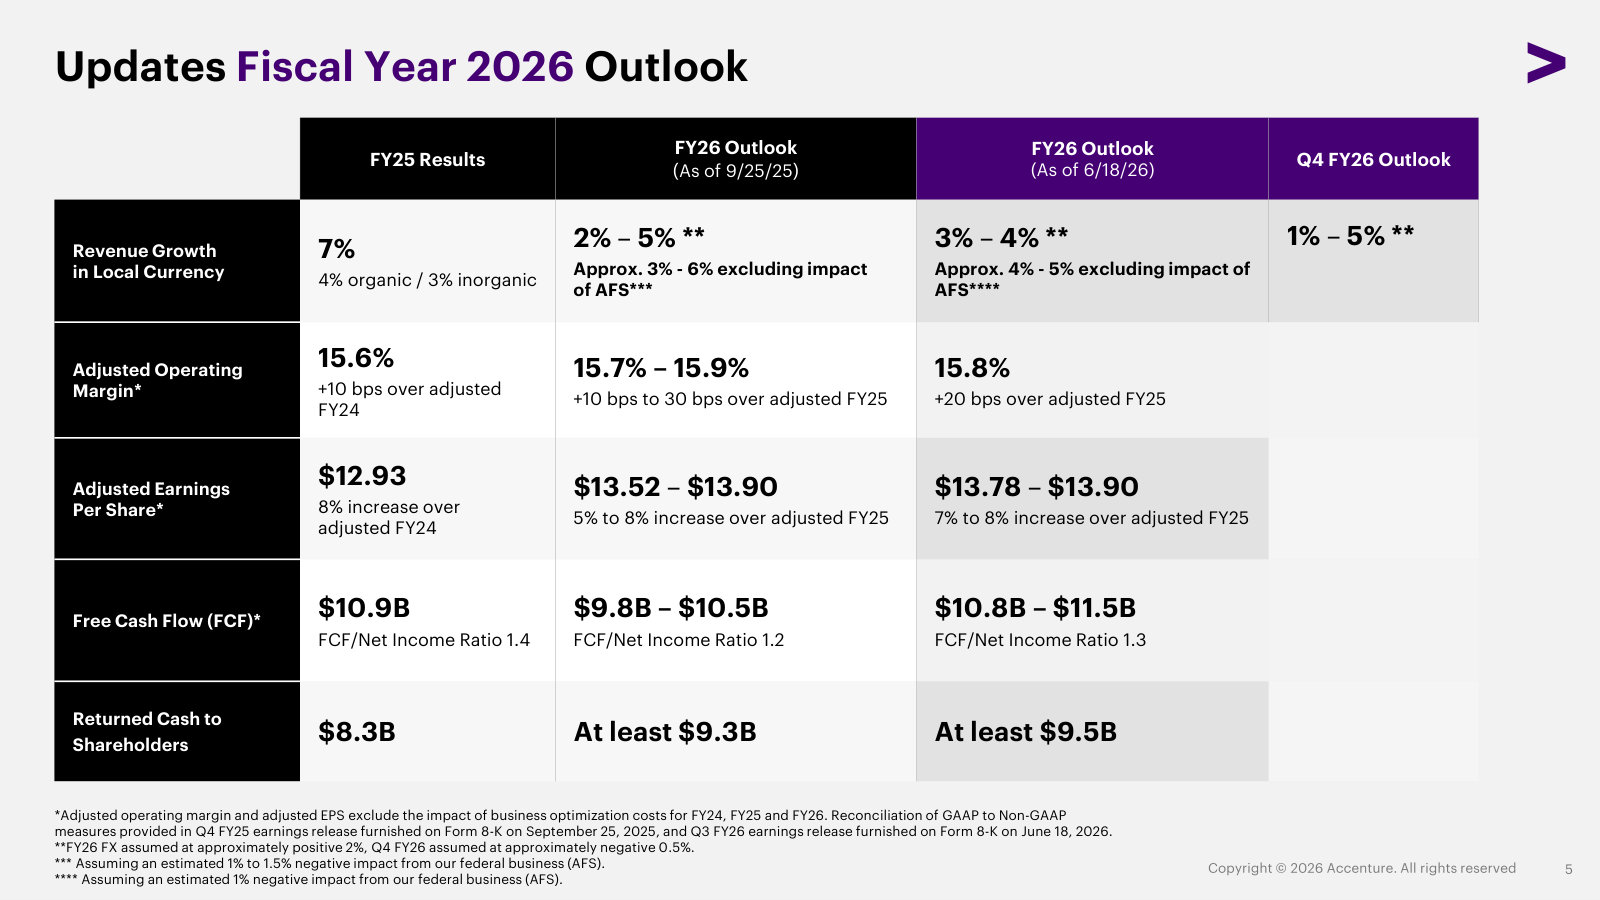
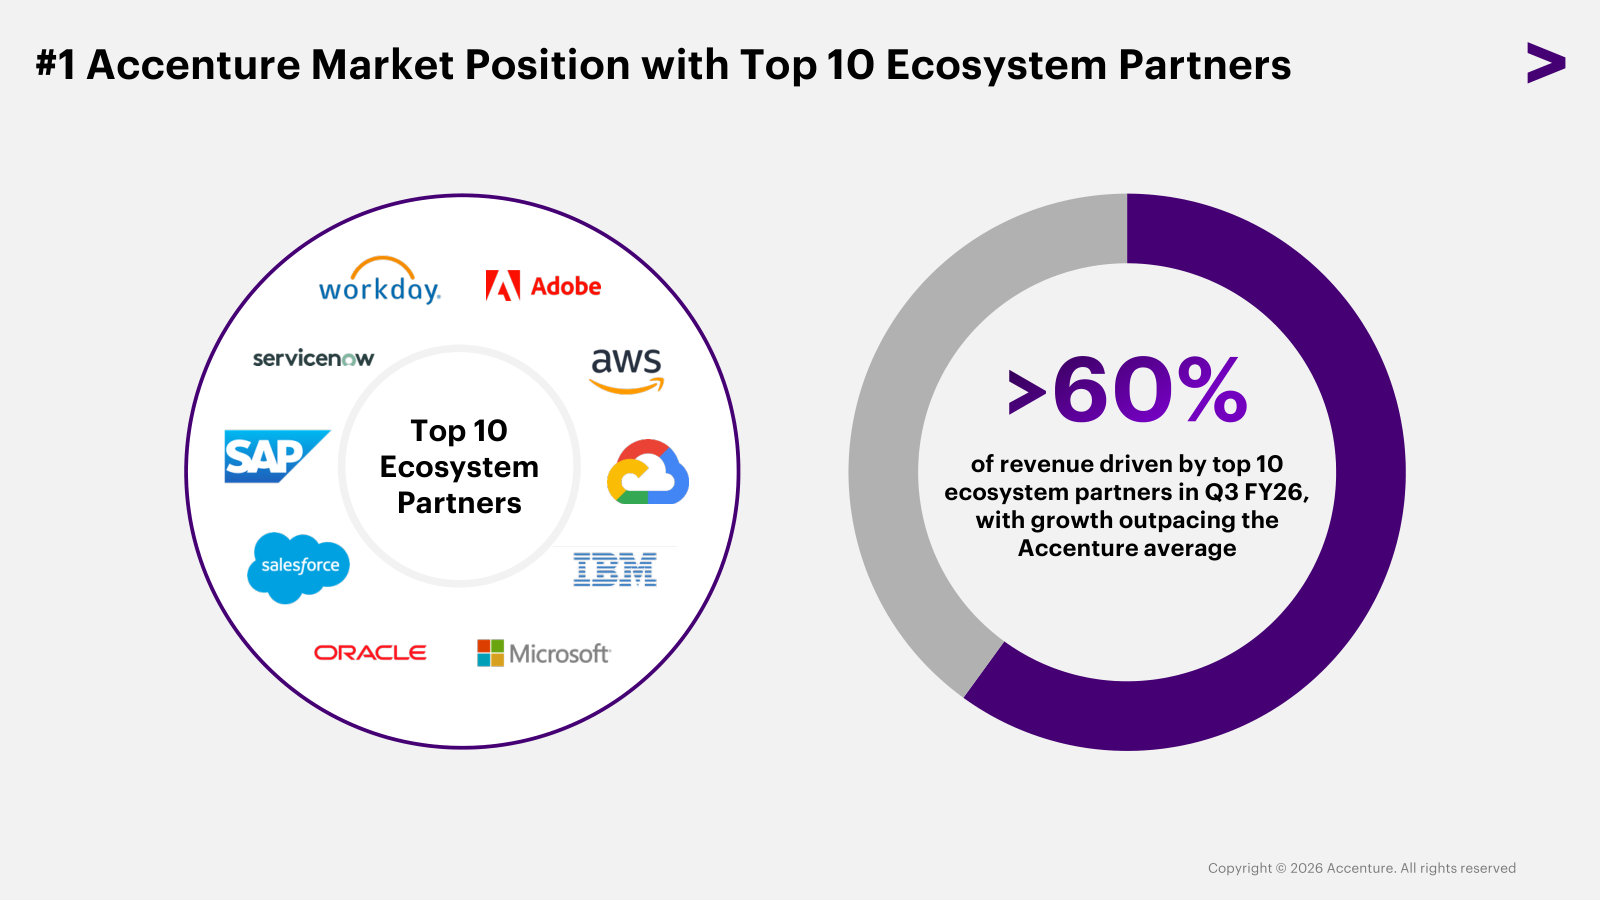
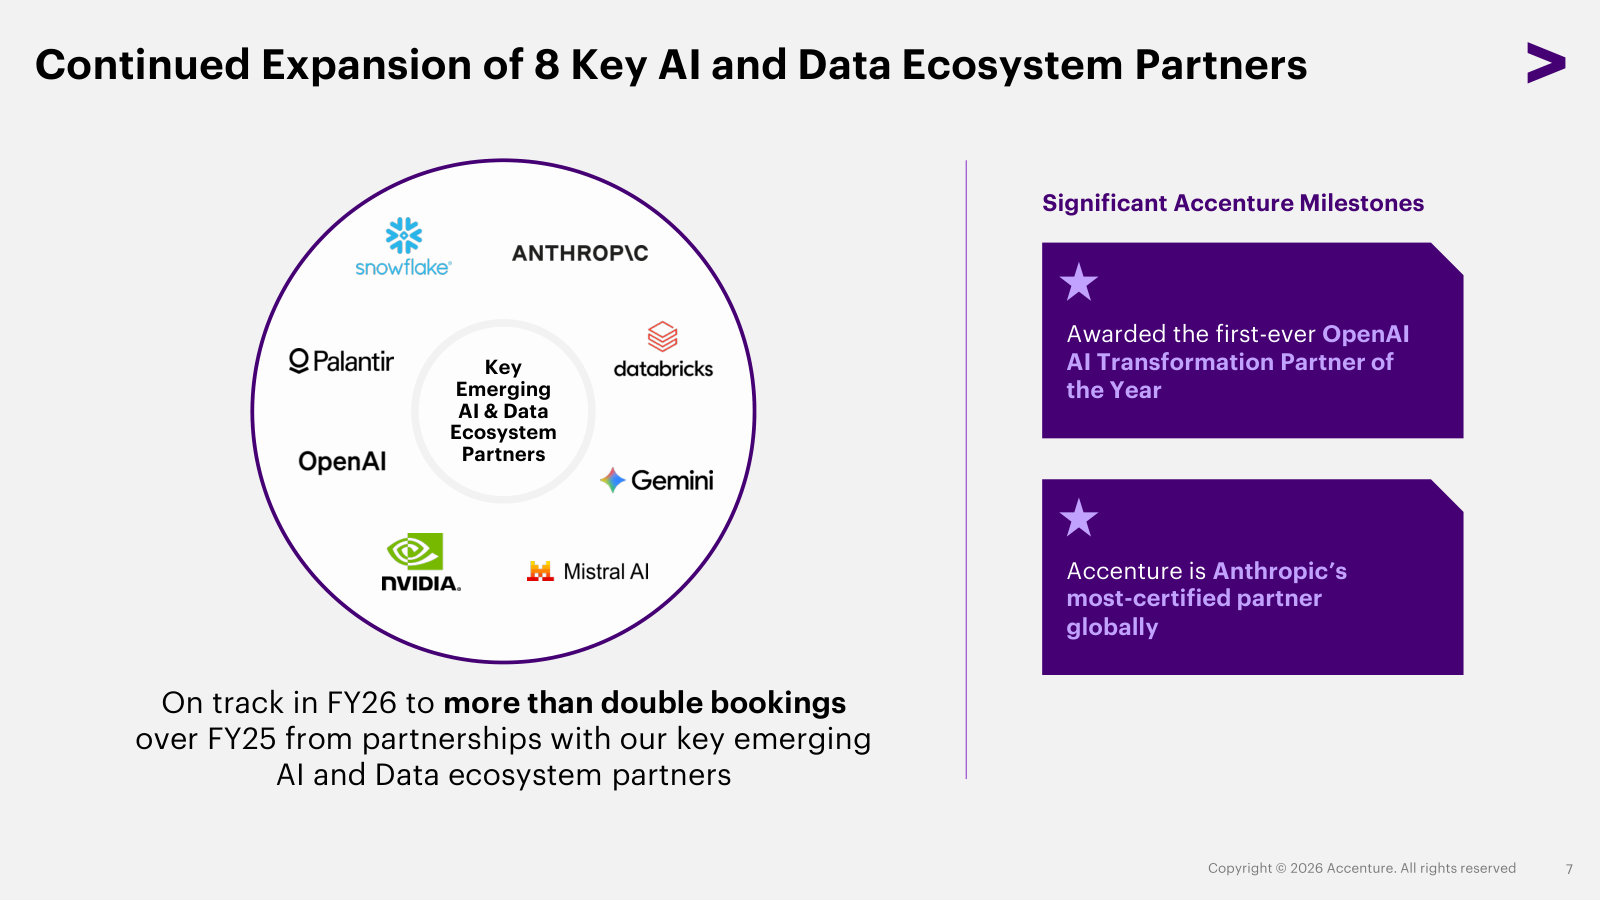
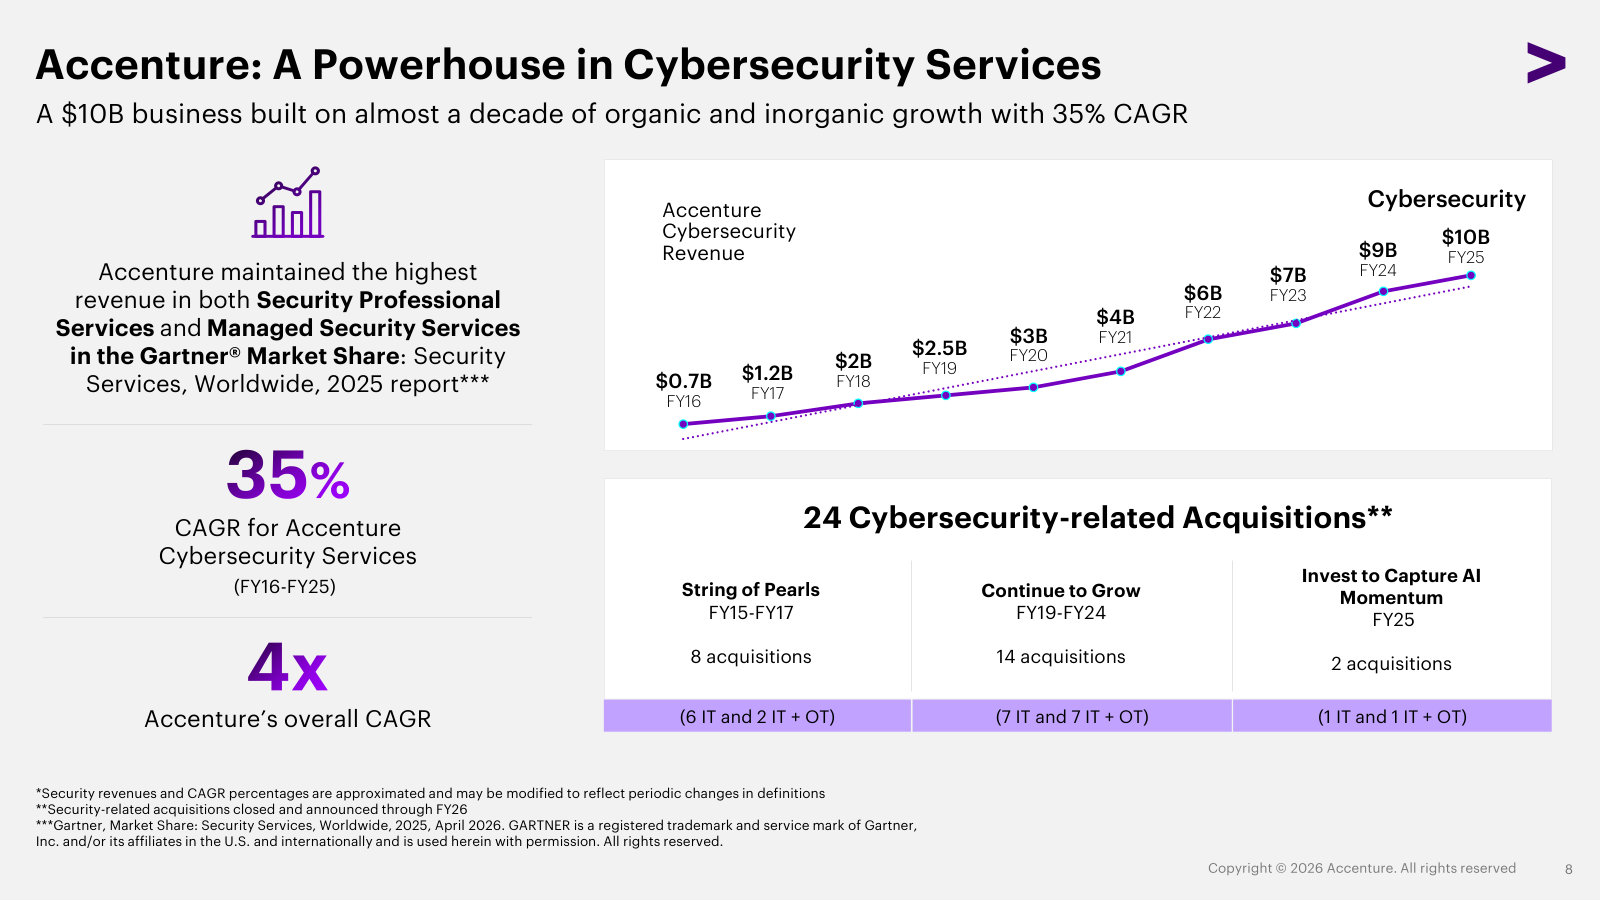
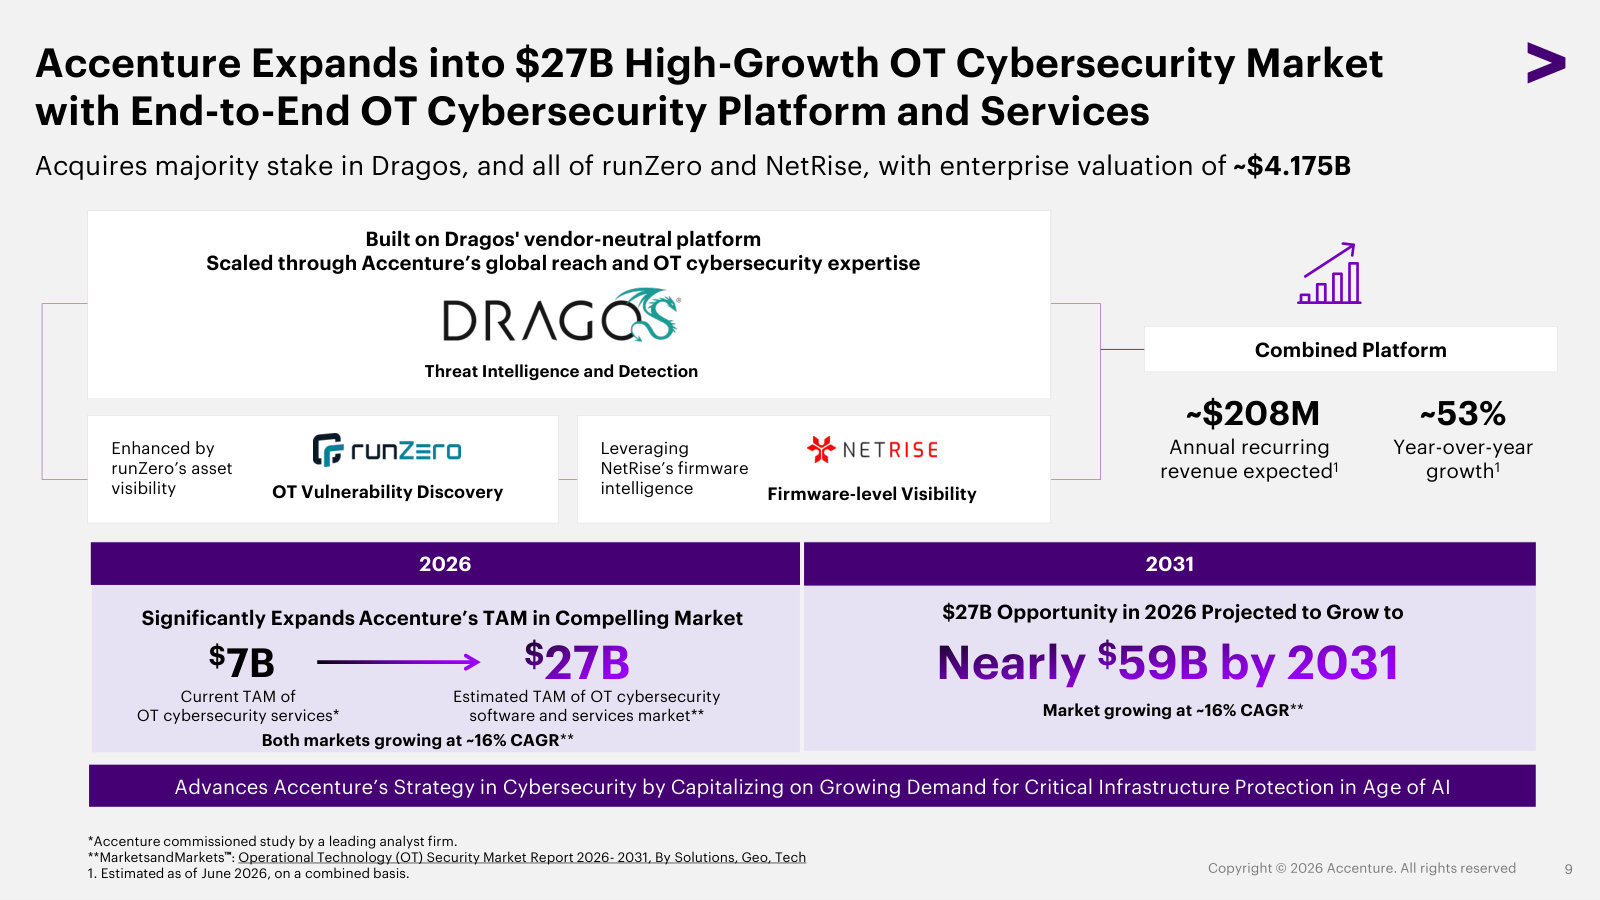
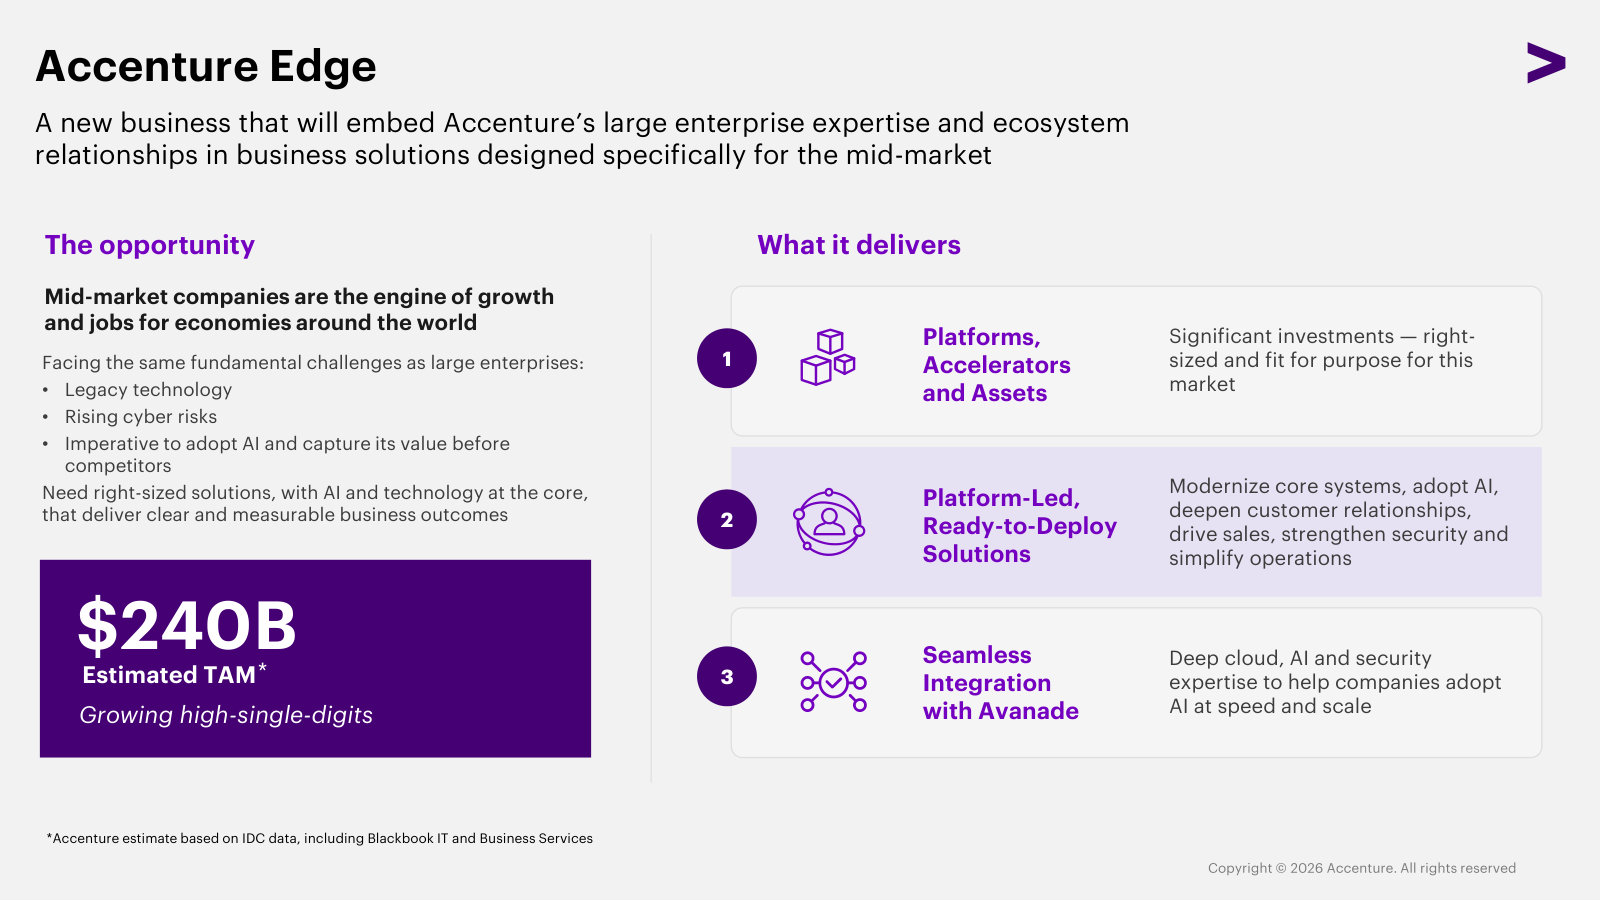
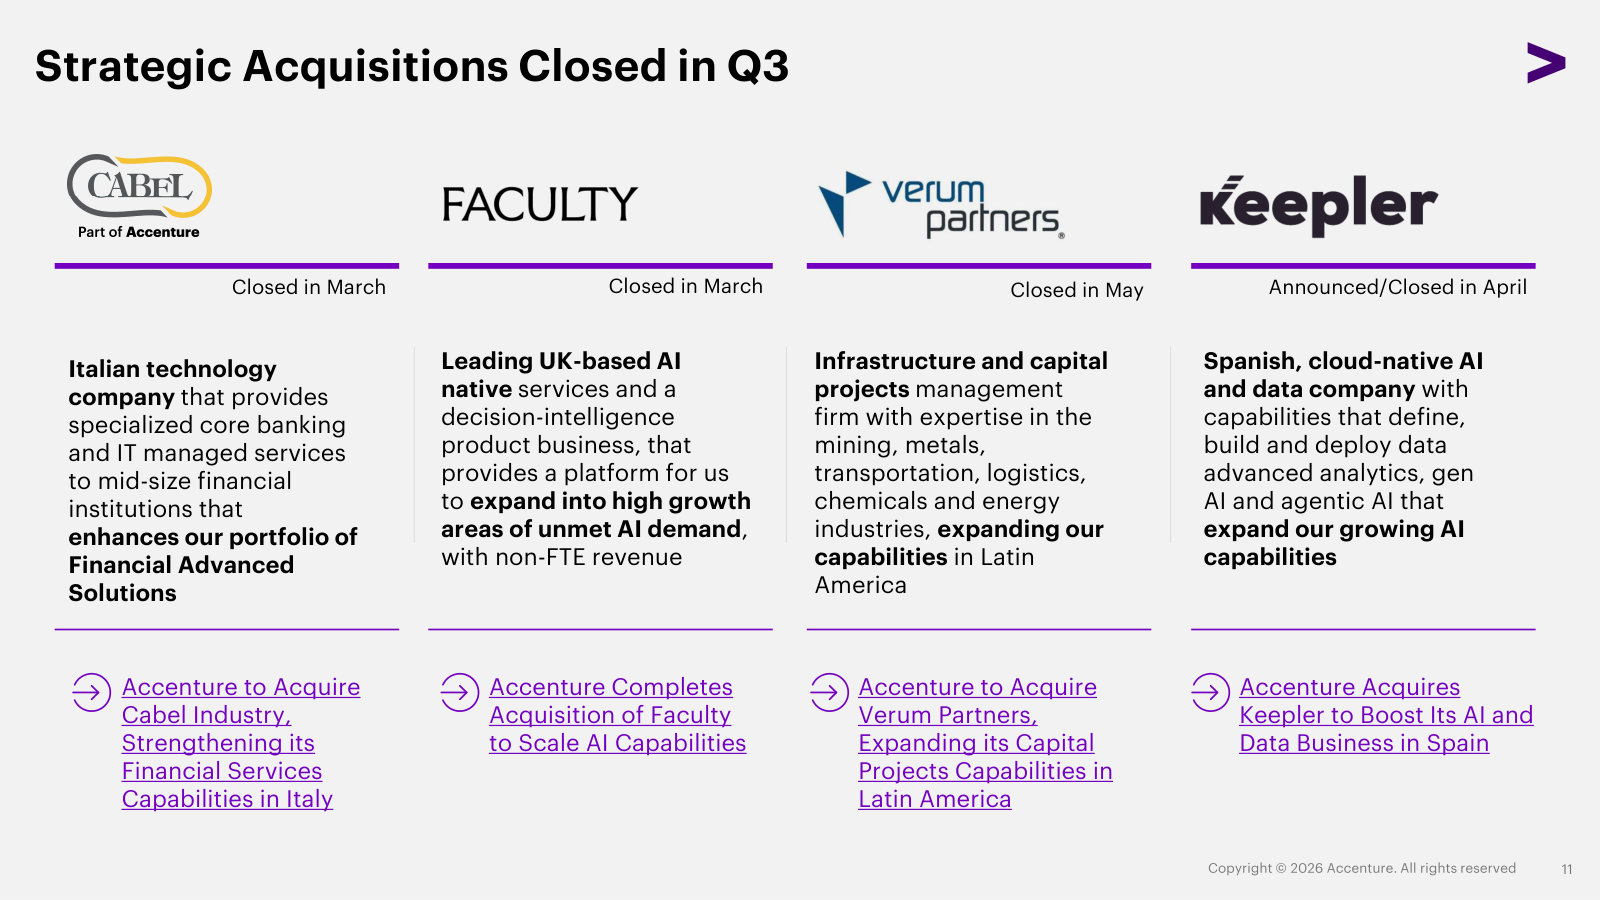
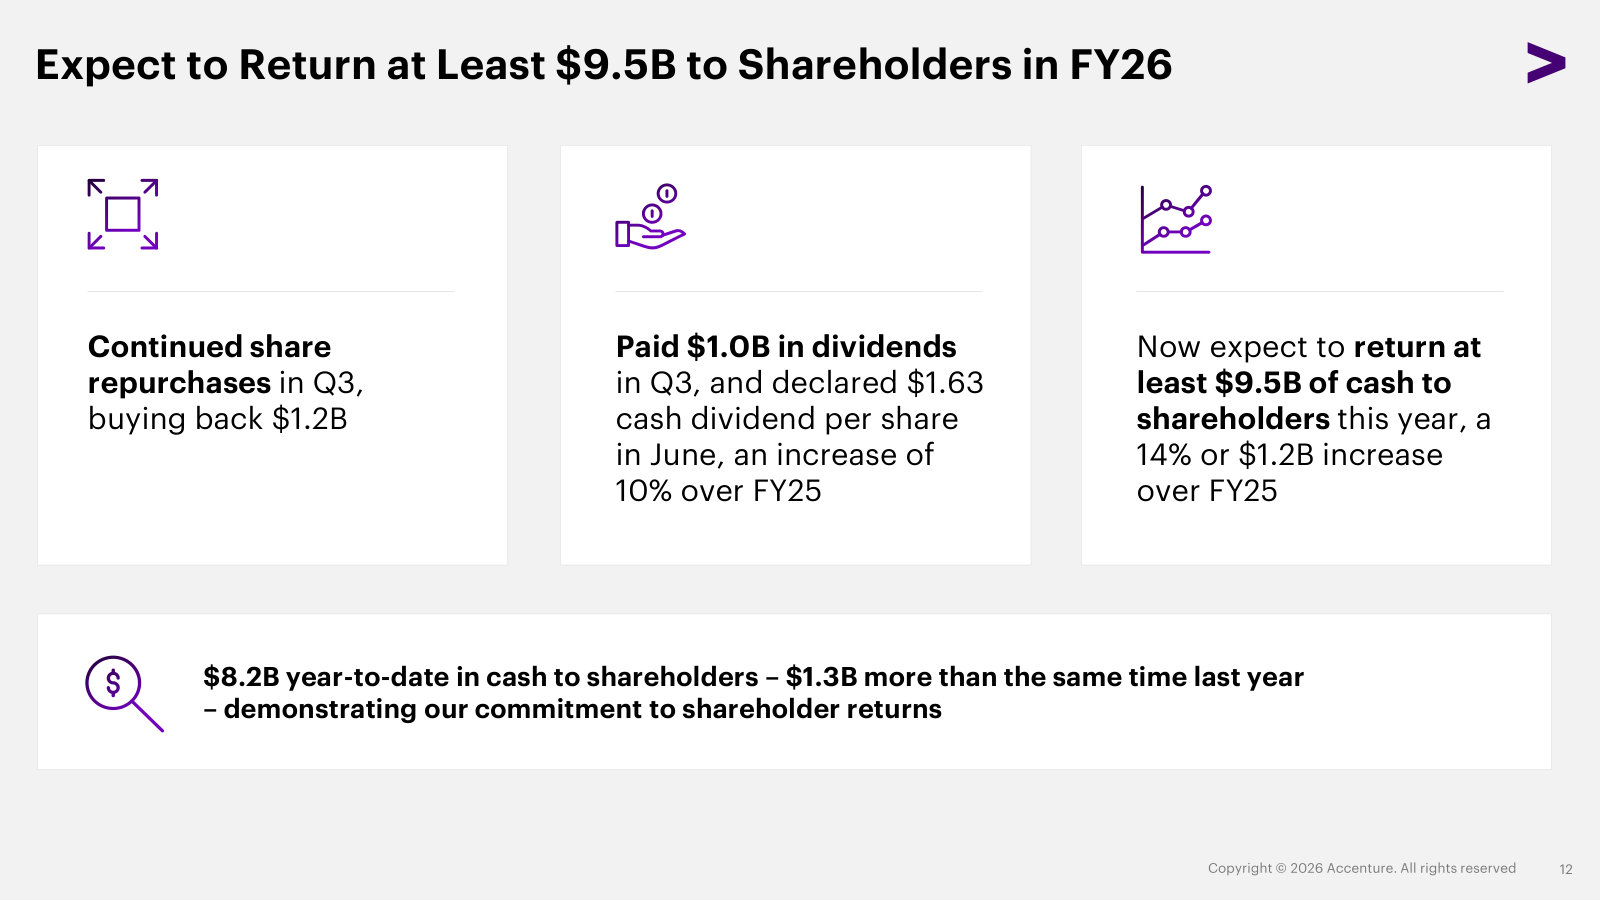
p. 2 — One-page Q3 snapshot: $18.7B revenue by geography, industry and type of work, plus margin, EPS, bookings and cash returned. · Open the full presentation →p. 4 — Management's own summary of the quarter — reinvention bookings, cybersecurity, the new Edge business, guidance and M&A in one view. · Open the full presentation →p. 5 — FY26 guidance versus FY25 actuals: revenue growth, adjusted margin, EPS, free cash flow and cash to be returned. · Open the full presentation →p. 6 — The partner-led model in one chart: the ten platform vendors Accenture builds on, and the >60% of revenue tied to them. · Open the full presentation →p. 7 — The emerging AI and data vendors — Anthropic, OpenAI, NVIDIA, Databricks and more — Accenture is certifying and building practices around. · Open the full presentation →p. 8 — How Accenture builds a business: cybersecurity grown to $10B at a 35% CAGR through 24 acquisitions plus organic growth over a decade. · Open the full presentation →p. 9 — A worked example of expansion — the ~$4.2B Dragos/runZero/NetRise deals pushing into the $27B operational-technology security market. · Open the full presentation →p. 10 — Accenture Edge, a newly launched unit aiming the firm's enterprise playbook at the mid-market, a $240B TAM it has under-served. · Open the full presentation →p. 11 — The tuck-in engine in practice: four companies bought this quarter and what each adds — banking tech, AI, capital projects, Spanish AI/data. · Open the full presentation →p. 12 — Capital allocation: at least $9.5B to be returned in FY26 via buybacks and a dividend raised 10%. · Open the full presentation →
Featured for its explainers — the Song segment deep-dive, the AI product stack, the commercial-model shift and the AI business's scale. · Open the full document →
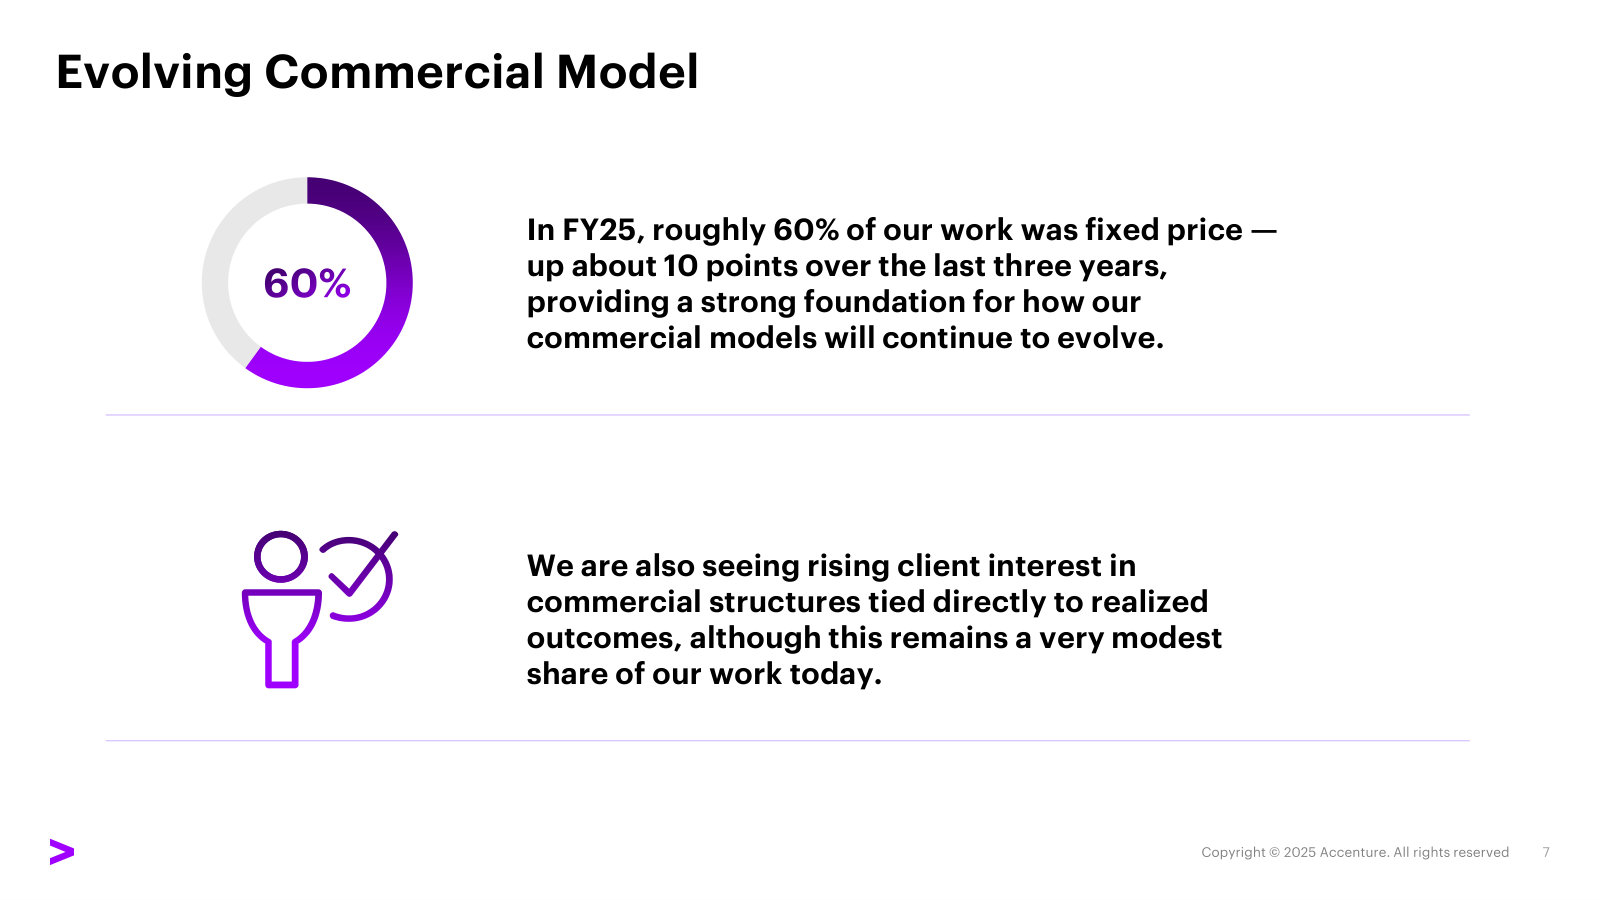
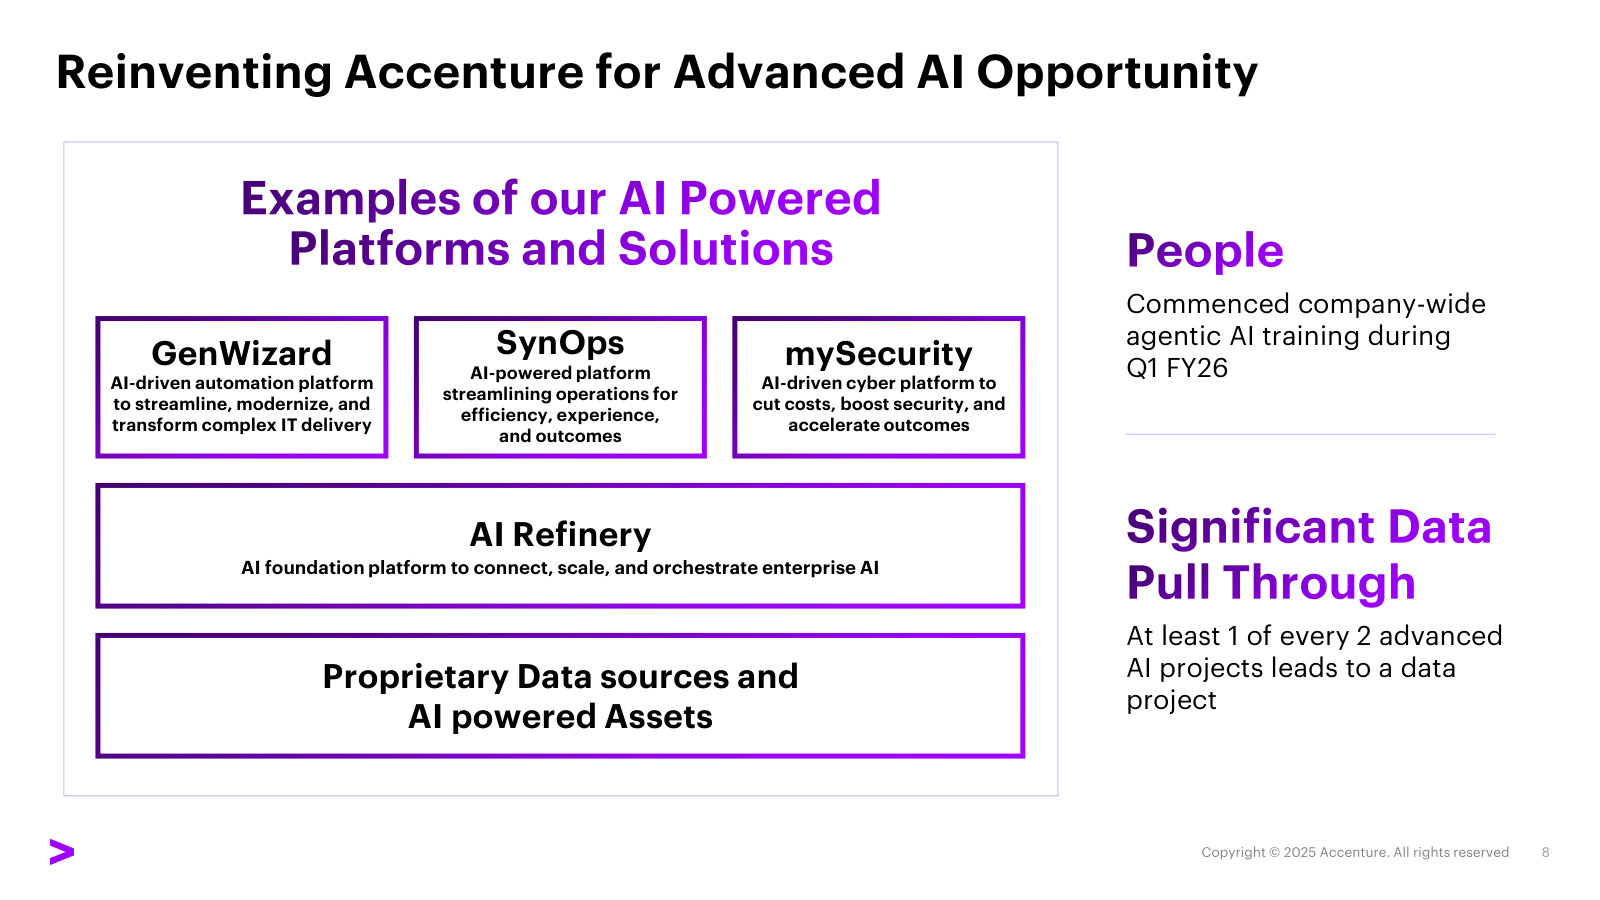
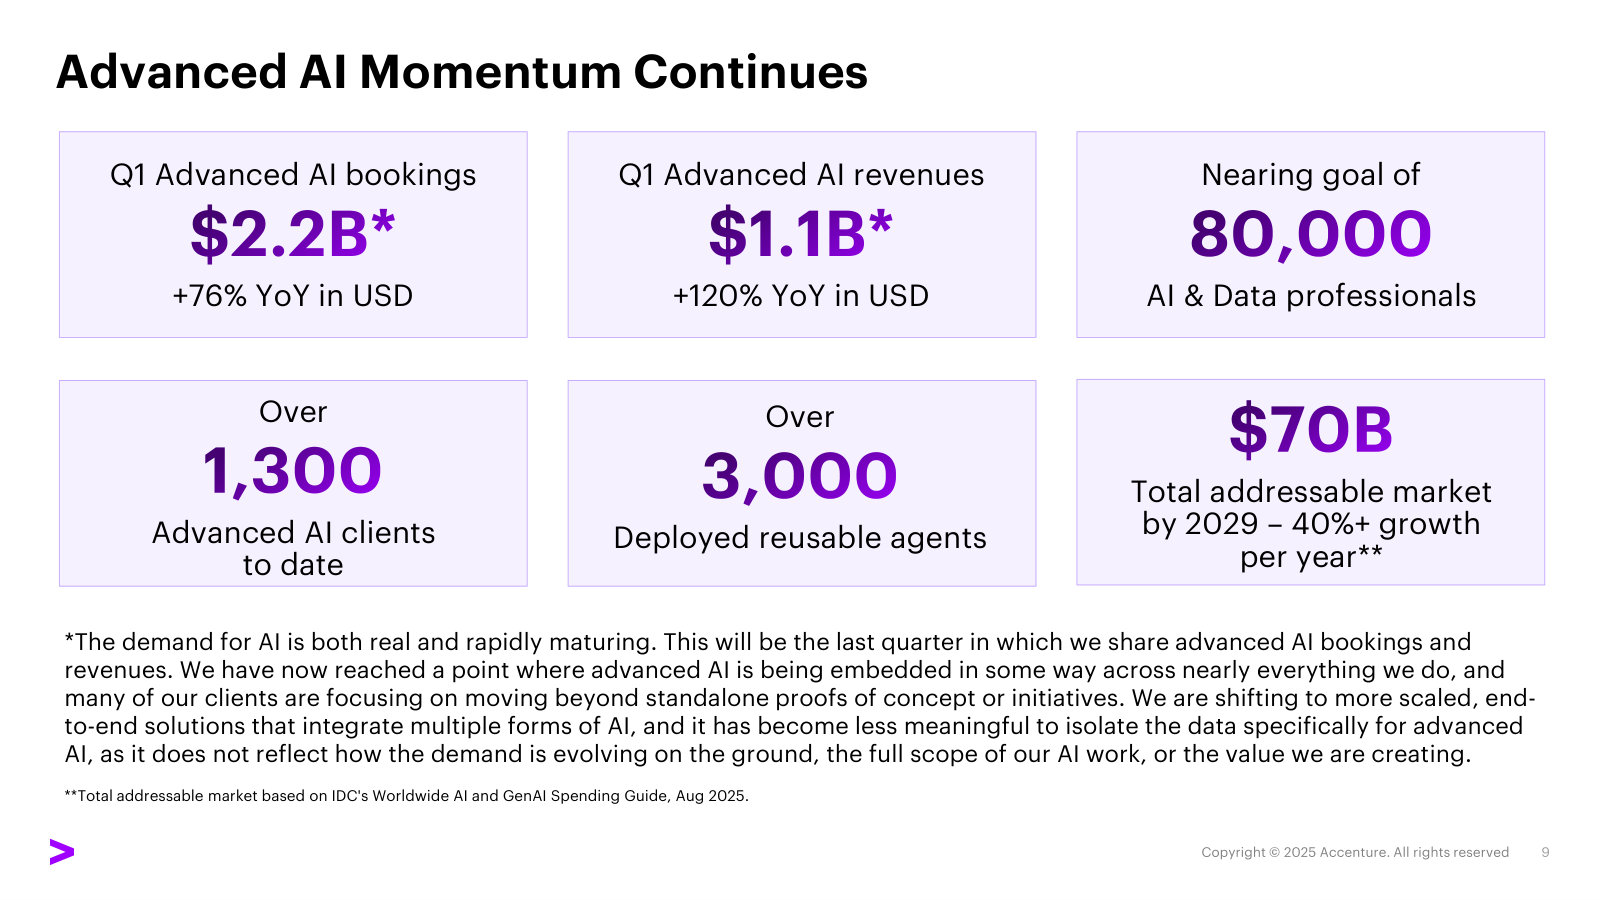
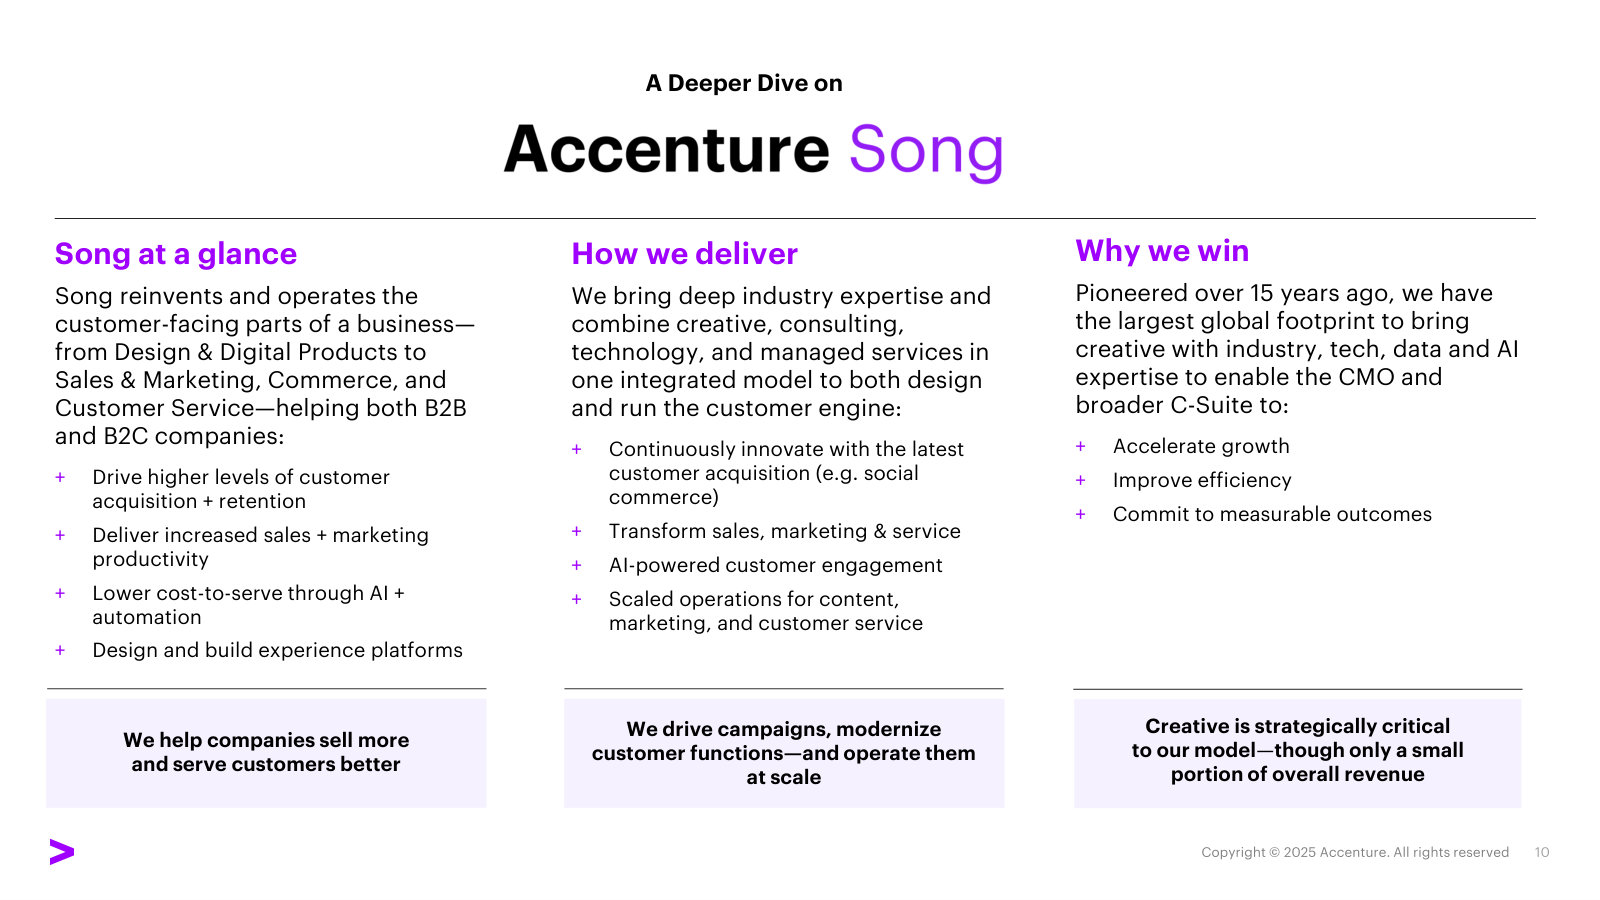
p. 7 — How Accenture charges: ~60% of work is now fixed-price, up ~10 points in three years, with early demand for outcome-linked pricing. · Open the full presentation →p. 8 — The AI product stack — GenWizard, SynOps, mySecurity and the AI Refinery foundation layer — that Accenture sells on top of client data. · Open the full presentation →p. 9 — The scale of the AI business: Q1 advanced-AI bookings $2.2B and revenue $1.1B, ~80,000 AI staff, against a ~$70B market by 2029. · Open the full presentation →p. 10 — A deeper dive on Accenture Song — what the creative and customer-experience segment does, how it delivers and why it wins. · Open the full presentation →
The full-year deck: the cleanest annual snapshot of the business, plus the AI-investment and acquisition engine behind its growth. · Open the full document →
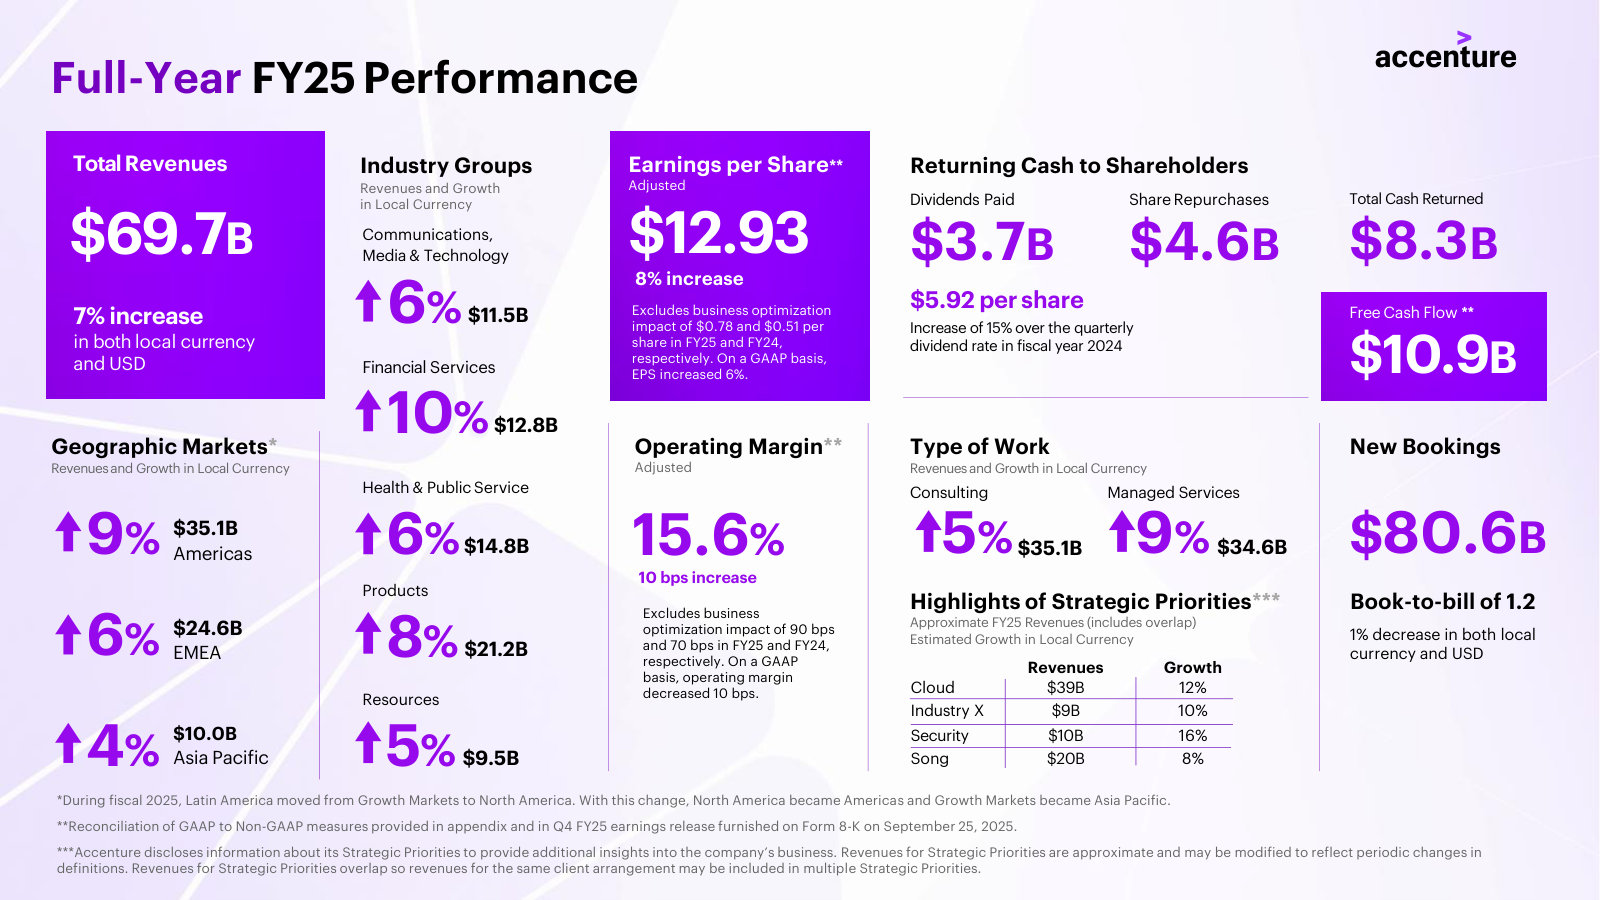
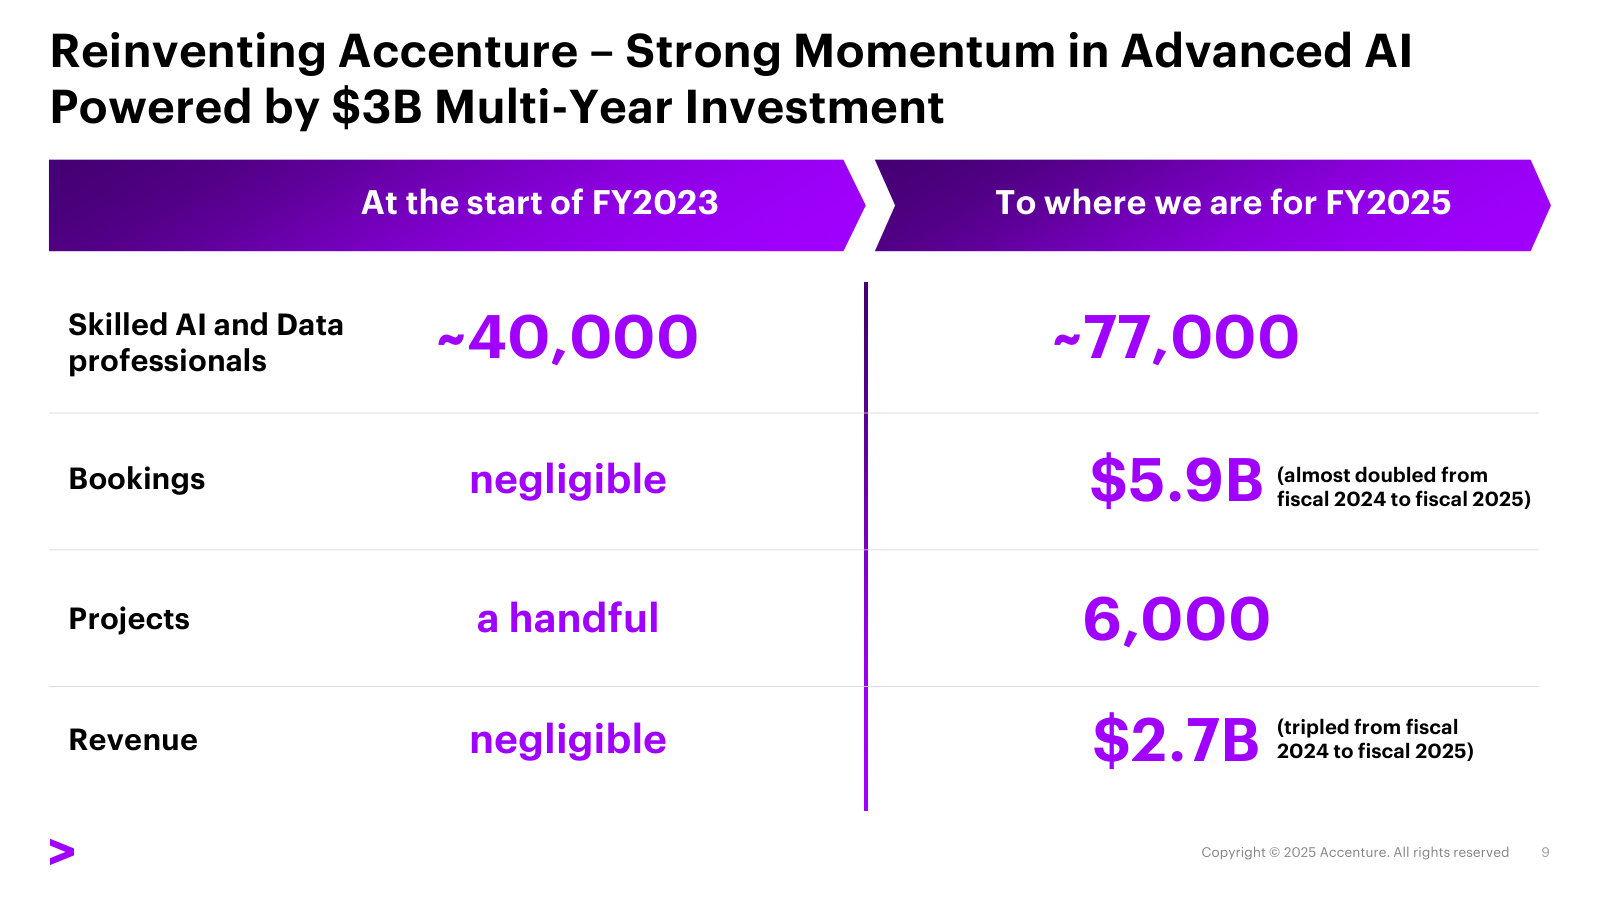
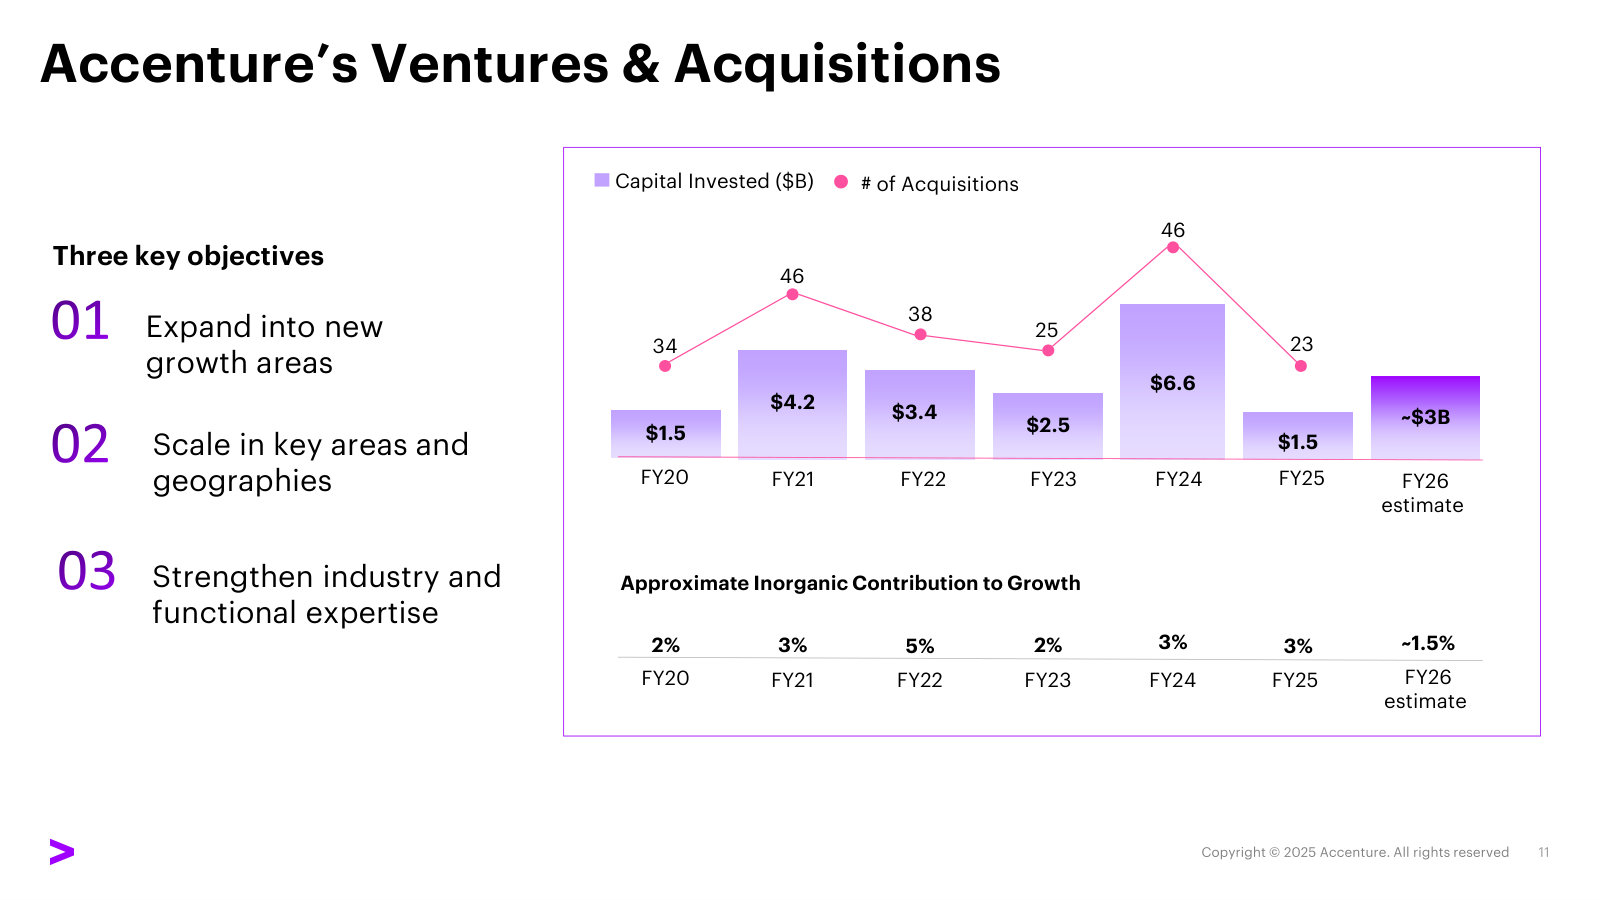
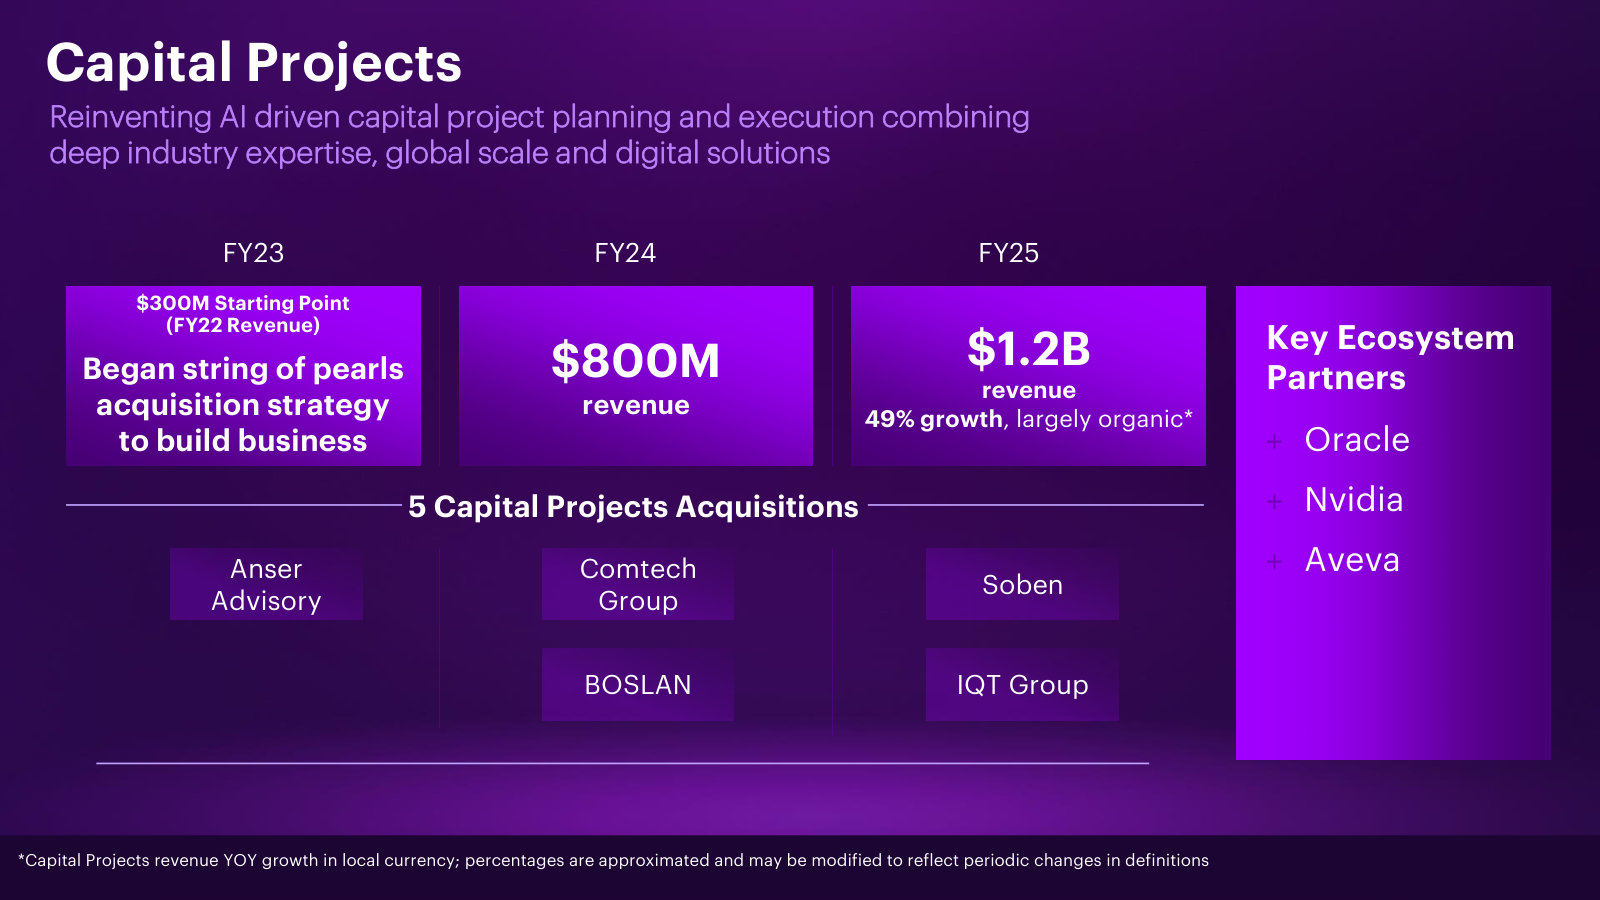
p. 3 — Full-year FY25 in one page: $69.7B revenue by industry, geography and work type, plus strategic-priority revenues (Cloud $39B, Song $20B). · Open the full presentation →p. 9 — The reinvention scoreboard: from FY23 to FY25, AI/data staff ~40k→77k, bookings ~0→$5.9B, revenue ~0→$2.7B, behind a $3B investment. · Open the full presentation →p. 11 — The M&A engine quantified — capital invested and deal count FY20–FY26, and how much of each year's growth is inorganic. · Open the full presentation →p. 13 — The 'string of pearls' playbook in one vertical: capital-projects revenue built from $300M to $1.2B via five tuck-in acquisitions. · Open the full presentation →
Q2 FY26 Earnings Presentation — Q2 FY26 · 24 pages · The prior quarter's deck: the CyberCX cybersecurity acquisition, first-half industry rankings, and Marc Warner's arrival as CTO. · Open →
Q4 & Full-Year FY24 Earnings Supplement — FY24 · 13 pages · FY24 full-year metrics — the prior-year baseline the FY25 growth figures are measured against. · Open →