Full Report
The numbers behind Accenture plc: as-reported financial statements and company metrics for FY2021–FY2025, traced to the source filings, opened with the share-price history those statements have to justify. Every linked figure opens the exact page of the filing it was printed on, with the statement row highlighted. Amounts in US$ millions unless noted.
Reading notes: Accenture prints its consolidated statements in thousands of U.S. dollars; this tab is rescaled to US$ millions for readability. Each citation's anchor is the exact figure as printed (in thousands), and the quote is the verbatim statement row. Fiscal year ends August 31. FY2025 = year ended August 31, 2025. FY2021 income-statement, balance-sheet and cash-flow figures are the comparative (2021) columns of the FY2022 Form 10-K (US GAAP presentation), not the separate FY2021 Irish statutory 'Directors' Report and Consolidated Financial Statements', which presents the group under a different (FRS 102) format. Revenue by Industry Group and by Type of Work: FY2023–FY2025 are cited to the FY2025 Form 10-K (Note 16); FY2021–FY2022 to the FY2023 Form 10-K (Note 16). Both reflect the June 1, 2022 move of Aerospace Defense from Communications, Media Technology to Products.
Share Price — Available History Since March 2026
The stock closed at $142.14 on Jul 07, 2026 — down 28% over the window shown, trading between $124.44 and $201.33. At that close the stock trades at 12× FY2025 diluted EPS as reported below.
Source: market price feed, daily closes, Mar 2026–Jul 2026 — the feed marks this available history as partial. Price return only, excludes dividends.
FY2025 at a Glance
Revenue (US$ millions)
Operating income (US$ millions)
Net income (US$ millions)
Diluted EPS
Source: FY2025 consolidated statements [1] [2] [3] [4]. Click any linked figure to open the filing page with the row highlighted.
Revenue by Industry Group
| Revenue by Industry Group | FY2021 | FY2022 | FY2023 | FY2024 | FY2025 |
|---|---|---|---|---|---|
| Communications, Media and Technology | 9,801 | 12,200 | 11,453 | 10,837 | 11,454 |
| Financial Services | 9,933 | 11,811 | 12,132 | 11,610 | 12,774 |
| Health and Public Service | 9,498 | 11,226 | 12,560 | 13,841 | 14,763 |
| Products | 14,439 | 18,275 | 19,104 | 19,554 | 21,197 |
| Resources | 6,863 | 8,082 | 8,863 | 9,054 | 9,485 |
| Total revenues | 50,533 | 61,594 | 64,112 | 64,896 | 69,673 |
| Total revenues growth, derived | — | +21.9% | +4.1% | +1.2% | +7.4% |
Source: Form 10-K Note 16, Segment Reporting — Revenues by industry group (Aerospace & Defense reclassified from CMT to Products effective June 1, 2022; prior periods conformed) [5] [6]. Click any linked figure to open the filing page with the row highlighted.
Operating Income by Geographic Market
| Operating Income by Geographic Market | FY2021 | FY2022 | FY2023 | FY2024 | FY2025 |
|---|---|---|---|---|---|
| Americas | — | — | 4,644 | 5,080 | 5,324 |
| EMEA | — | — | 2,483 | 2,804 | 3,091 |
| Asia Pacific | — | — | 1,682 | 1,713 | 1,810 |
| Total operating income | — | — | 8,810 | 9,596 | 10,226 |
Source: Form 10-K Note 16, Segment Reporting — operating income by reportable geographic segment (Americas / EMEA / Asia Pacific basis, FY2023 restated; FY2021–FY2022 predate the reclassification and are not shown on this basis) [7]. Click any linked figure to open the filing page with the row highlighted.
Income Statement
Source: Consolidated Income Statements [1] [2] [3] [4]. Click any linked figure to open the filing page with the row highlighted.
Columns marked E are consensus analyst estimates shown alongside reported results for direct comparison; they are not company guidance.
Estimate source: Yahoo Finance analyst consensus, as of 2026-07-07. Estimate figures link to the consensus source, not to filing pages.
Balance Sheet
Source: Consolidated Balance Sheets [8] [9] [10] [11]. Click any linked figure to open the filing page with the row highlighted.
Cash Flow
Source: Consolidated Cash Flows Statements [12] [13] [14] [15]. Click any linked figure to open the filing page with the row highlighted.
Revenue by Type of Work
| Revenue by Type of Work | FY2021 | FY2022 | FY2023 | FY2024 | FY2025 |
|---|---|---|---|---|---|
| Consulting | 27,338 | 34,076 | 33,613 | 33,195 | 35,107 |
| Managed Services | 23,196 | 27,518 | 30,499 | 31,701 | 34,566 |
| Total revenues | 50,533 | 61,594 | 64,112 | 64,896 | 69,673 |
Source: Form 10-K Note 16, Segment Reporting — Revenues by type of work (consulting and managed services) [5] [6]. Click any linked figure to open the filing page with the row highlighted.
New Bookings Demand
| New Bookings Demand | FY2021 | FY2022 | FY2023 | FY2024 | FY2025 |
|---|---|---|---|---|---|
| Consulting bookings | 30,600 | 37,900 | 36,200 | 37,000 | 37,600 |
| Managed services bookings | 28,700 | 33,900 | 36,000 | 44,200 | 43,000 |
| Total new bookings | 59,300 | 71,700 | 72,200 | 81,200 | 80,600 |
| Book-to-bill ratio | — | — | 1.1 | 1.3 | 1.2 |
| Quarterly client bookings over $100M (record in year) | — | — | — | — | 129 |
Source: company filings [16] [17] [18] [19]. Click any linked figure to open the filing page with the row highlighted.
Revenue by Geographic Market
| Revenue by Geographic Market | FY2021 | FY2022 | FY2023 | FY2024 | FY2025 |
|---|---|---|---|---|---|
| Americas | — | — | 32,193 | 32,552 | 35,057 |
| EMEA | — | — | 22,293 | 22,818 | 24,644 |
| Asia Pacific | — | — | 9,626 | 9,526 | 9,972 |
Source: company filings [7]. Click any linked figure to open the filing page with the row highlighted.
Workforce Talent
| Workforce Talent | FY2021 | FY2022 | FY2023 | FY2024 | FY2025 |
|---|---|---|---|---|---|
| Total workforce (people) | 624,000 | 721,000 | 733,000 | 774,000 | 779,000 |
| Utilization | 93.0% | 91.0% | 91.0% | 92.0% | 92.0% |
| Voluntary attrition | 14.0% | 19.0% | 13.0% | 13.0% | 14.0% |
| Diamond clients (largest relationships) | — | — | 300 | 310 | 305 |
| Skilled AI data practitioners | — | — | — | 57,000 | 77,000 |
Source: company filings [16] [20] [21] [19]. Click any linked figure to open the filing page with the row highlighted.
Cash Flow AI Economics
| Cash Flow AI Economics | FY2021 | FY2022 | FY2023 | FY2024 | FY2025 |
|---|---|---|---|---|---|
| Free cash flow | — | — | 9,000 | 8,600 | 10,900 |
| Generative / advanced AI revenue | — | — | — | — | 2,700 |
| Generative / advanced AI new bookings | — | — | — | — | 5,900 |
| Adjusted operating margin (non-GAAP) | — | — | 15.4% | 15.5% | 15.6% |
| Adjusted diluted EPS (non-GAAP) | — | — | 11.67 | 11.95 | 12.93 |
Source: company filings [22] [23] [24] [17]. Click any linked figure to open the filing page with the row highlighted.
Long-Term Record
| Fiscal year | Total revenue | Operating income | Net income attributable to Accenture plc | Diluted earnings per share | Net cash provided by operating activities | Purchases of property and equipment |
|---|---|---|---|---|---|---|
| FY2019 | 43,215 | 6,305 | 4,779 | 7.36 | 6,627 | (599) |
| FY2020 | 44,327 | 6,514 | 5,108 | 7.89 | 8,215 | (599) |
| FY2021 | 50,533 | 7,622 | 5,907 | 9.16 | 8,975 | (580) |
| FY2022 | 61,594 | 9,367 | 6,877 | 10.71 | 9,541 | (718) |
| FY2023 | 64,112 | 8,810 | 6,872 | 10.77 | 9,524 | (528) |
| FY2024 | 64,896 | 9,596 | 7,265 | 11.44 | 9,131 | (517) |
| FY2025 | 69,673 | 10,226 | 7,678 | 12.15 | 11,474 | (600) |
Source: consolidated statements across filings; older years from the standardized feed [12] [1] [13] [2]. Click any linked figure to open the filing page with the row highlighted.
Analyst Consensus
Current price
Mean target
Median target
High target
Low target
Estimate source: Yahoo Finance analyst consensus, as of 2026-07-07. Estimate figures link to the consensus source, not to filing pages.
Traceability
391 of 391 figures on this page (100%) link to the filing page where they are printed — click a linked figure to open the source PDF at that page with the row highlighted. Unlinked figures come from standardized data feeds or pre-filing years.
Accenture prints its consolidated statements in thousands of U.S. dollars; this tab is rescaled to US$ millions for readability. Each citation's anchor is the exact figure as printed (in thousands), and the quote is the verbatim statement row.
Fiscal year ends August 31. FY2025 = year ended August 31, 2025.
FY2021 income-statement, balance-sheet and cash-flow figures are the comparative (2021) columns of the FY2022 Form 10-K (US GAAP presentation), not the separate FY2021 Irish statutory 'Directors' Report and Consolidated Financial Statements', which presents the group under a different (FRS 102) format.
Revenue by Industry Group and by Type of Work: FY2023–FY2025 are cited to the FY2025 Form 10-K (Note 16); FY2021–FY2022 to the FY2023 Form 10-K (Note 16). Both reflect the June 1, 2022 move of Aerospace Defense from Communications, Media Technology to Products.
Operating Income by Geographic Market is shown on the current Americas / EMEA / Asia Pacific reportable-segment basis (FY2025 Form 10-K, Note 16, with FY2024 and FY2023 restated). The segments were renamed/recomposed twice in the period (Europe→EMEA with Middle East Africa added in FY2024; North America→Americas with Latin America added and Growth Markets→Asia Pacific in FY2025), so FY2021–FY2022 are not comparable on this basis and are left blank.
Long-Term Record: FY2019 figures are cited to the FY2021 Irish statutory report (Consolidated Profit and Loss Account / Cash Flows), where 'Turnover' equals US-GAAP Revenues; FY2020 to the FY2022 Form 10-K comparative column. FY2016–FY2018 are omitted because Accenture's pre-ASC 606 revenue basis (net of reimbursements) is not comparable to the current gross basis.
Quarterly statements are the single-quarter ('Three Months Ended') columns printed in Accenture's earnings press releases — including the cash-flow statement, which prints a three-month column, so no year-to-date differencing was needed. No share split occurred in the window (eps_split_adjusted = false).
2 figure(s) differed between the data feed and the filing; the filing value is shown (see the run's metrics/metrics_tab.json for the audit trail).
Accenture plc's management explains the business in its own materials. The slides below do the most of that work, pulled from the documents preserved in Sources. Each source link opens the complete presentation at that slide in a new tab.
Q3 FY26 Earnings Presentation — Q3 FY26
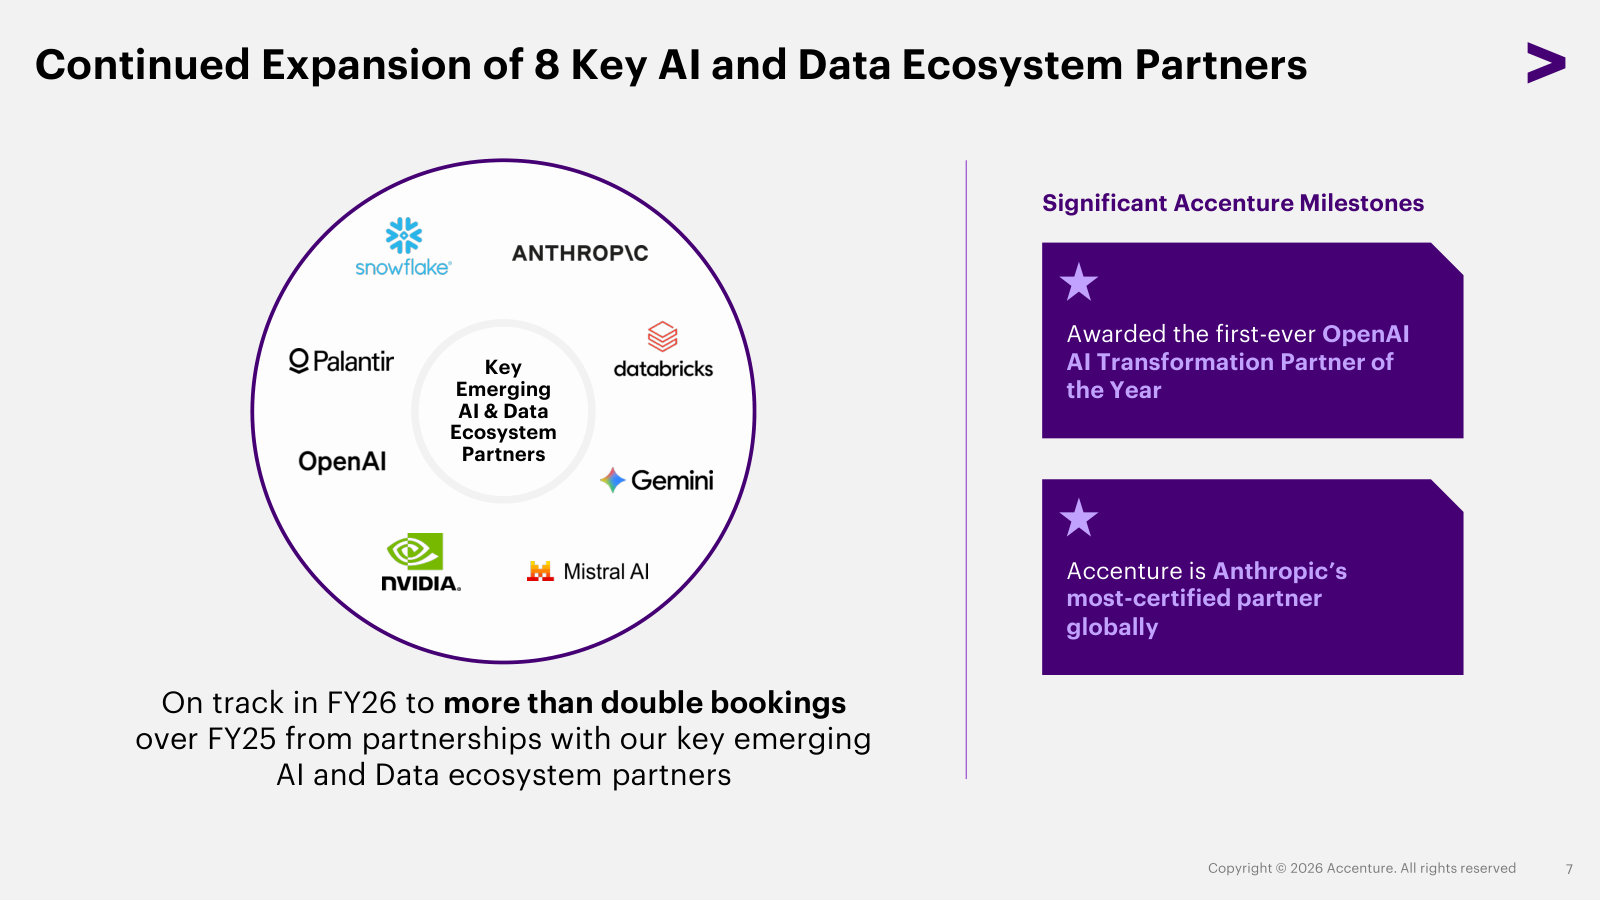
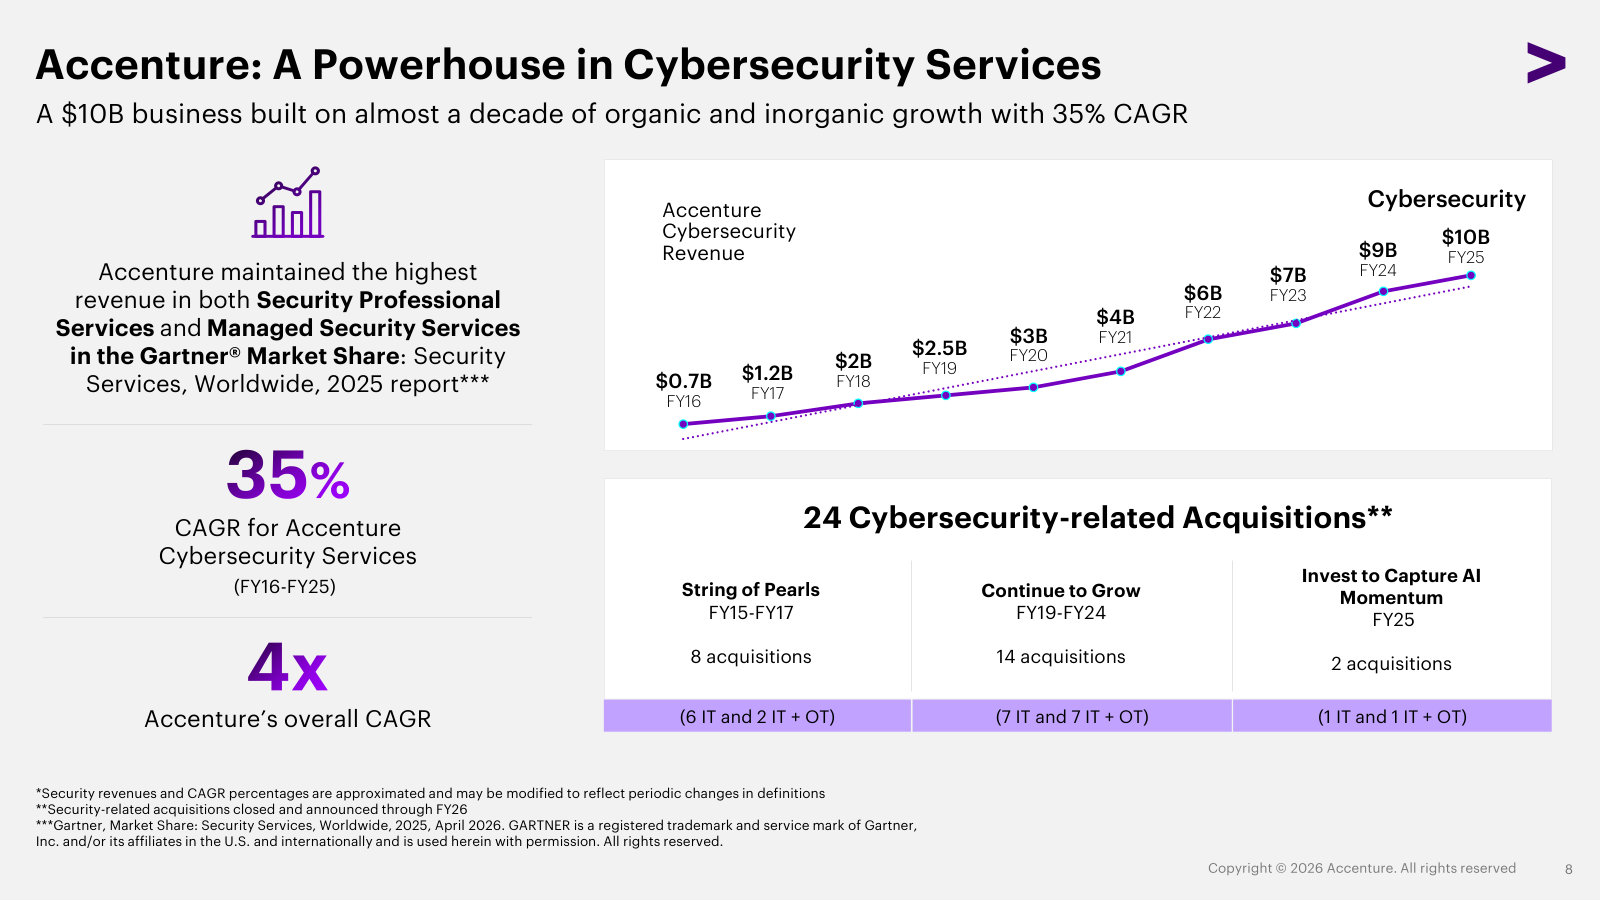
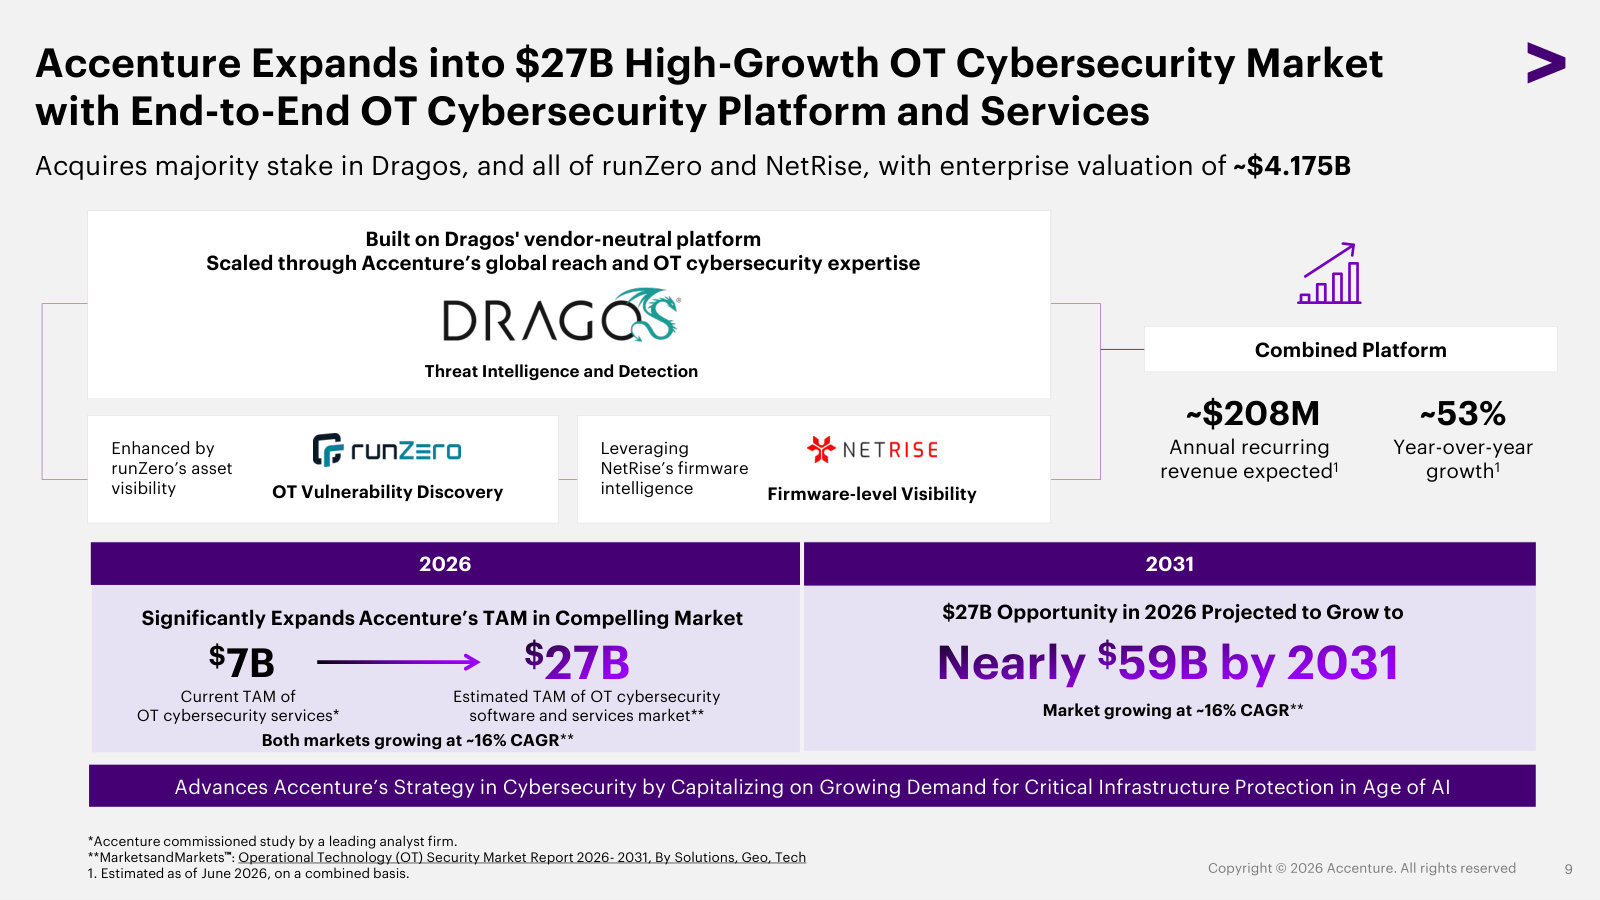
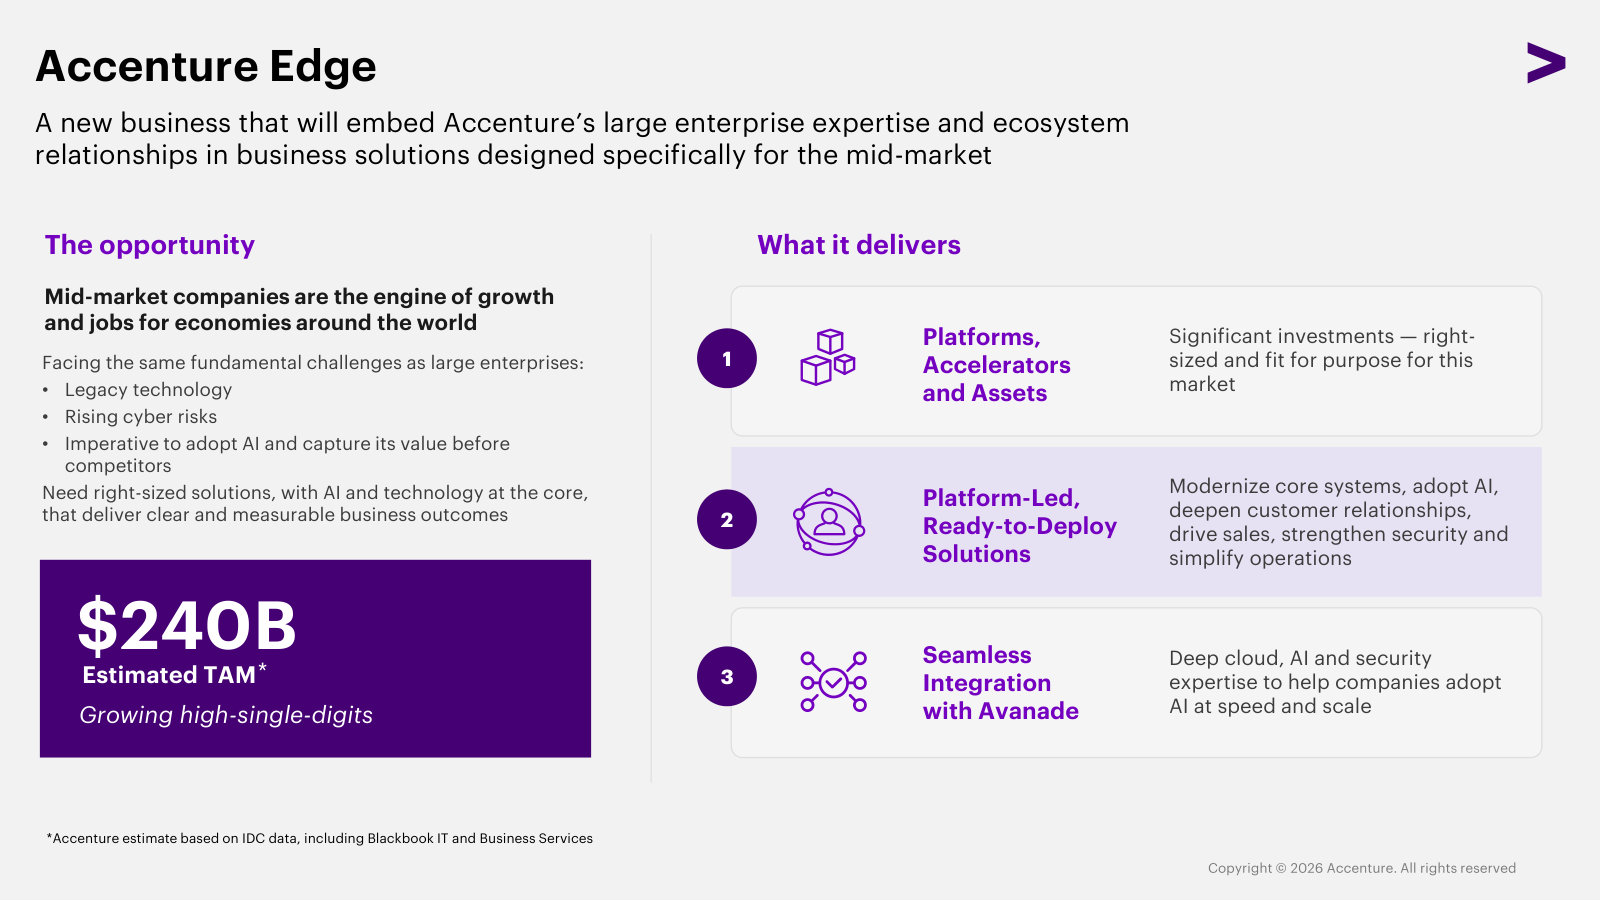
The newest deck: current results plus the freshest strategy — cybersecurity scale, the OT-security push and the new mid-market Edge unit. · Open the full document →
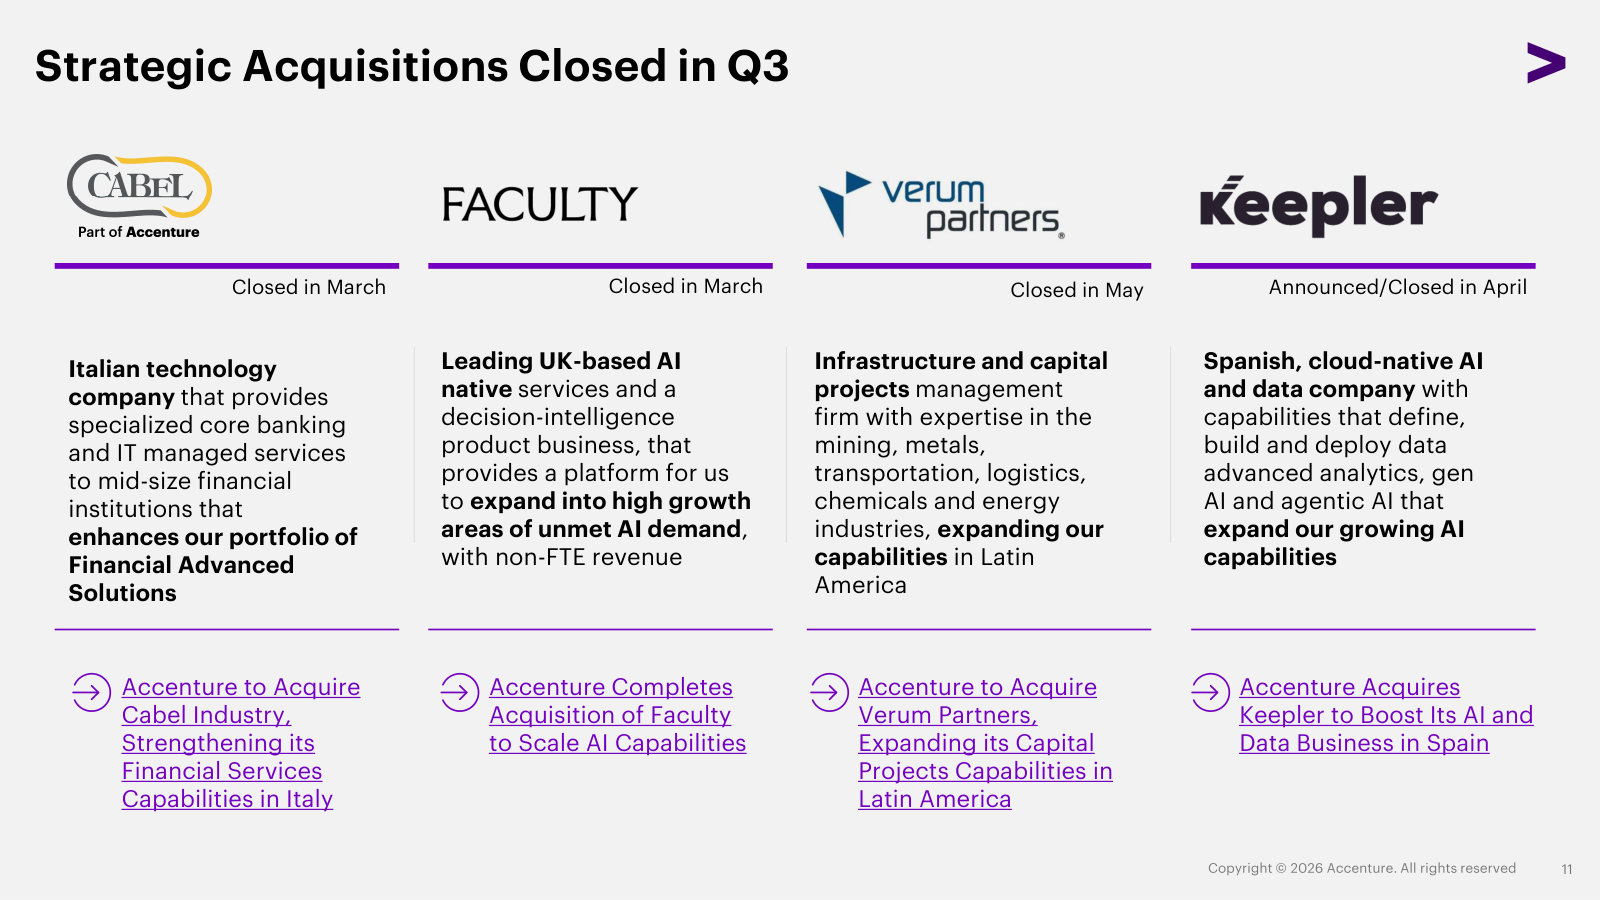
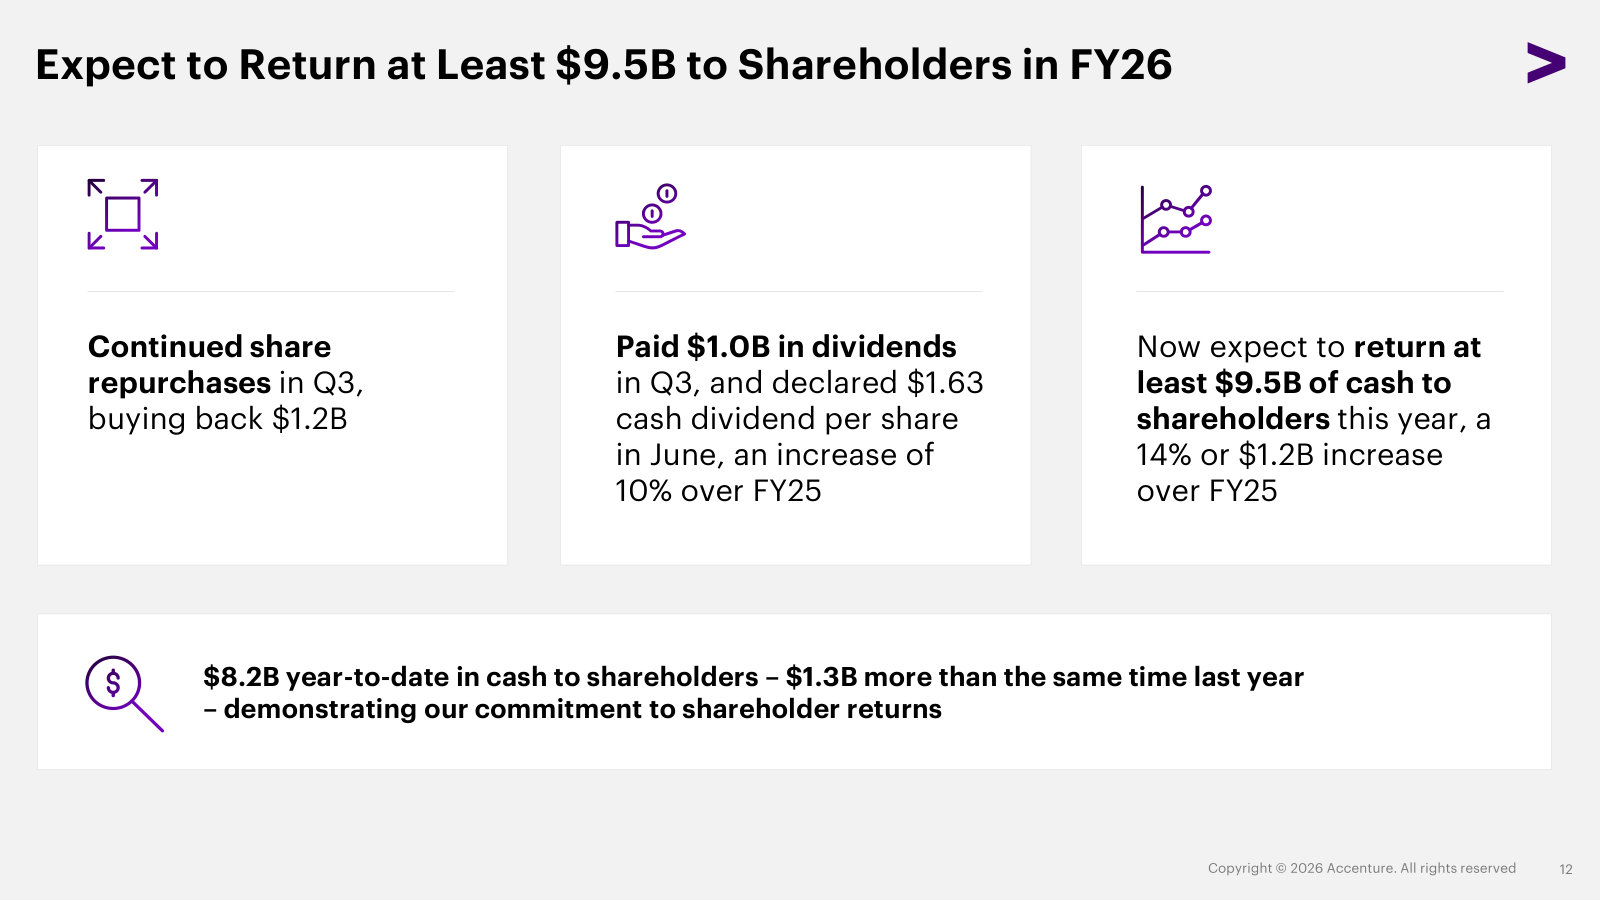
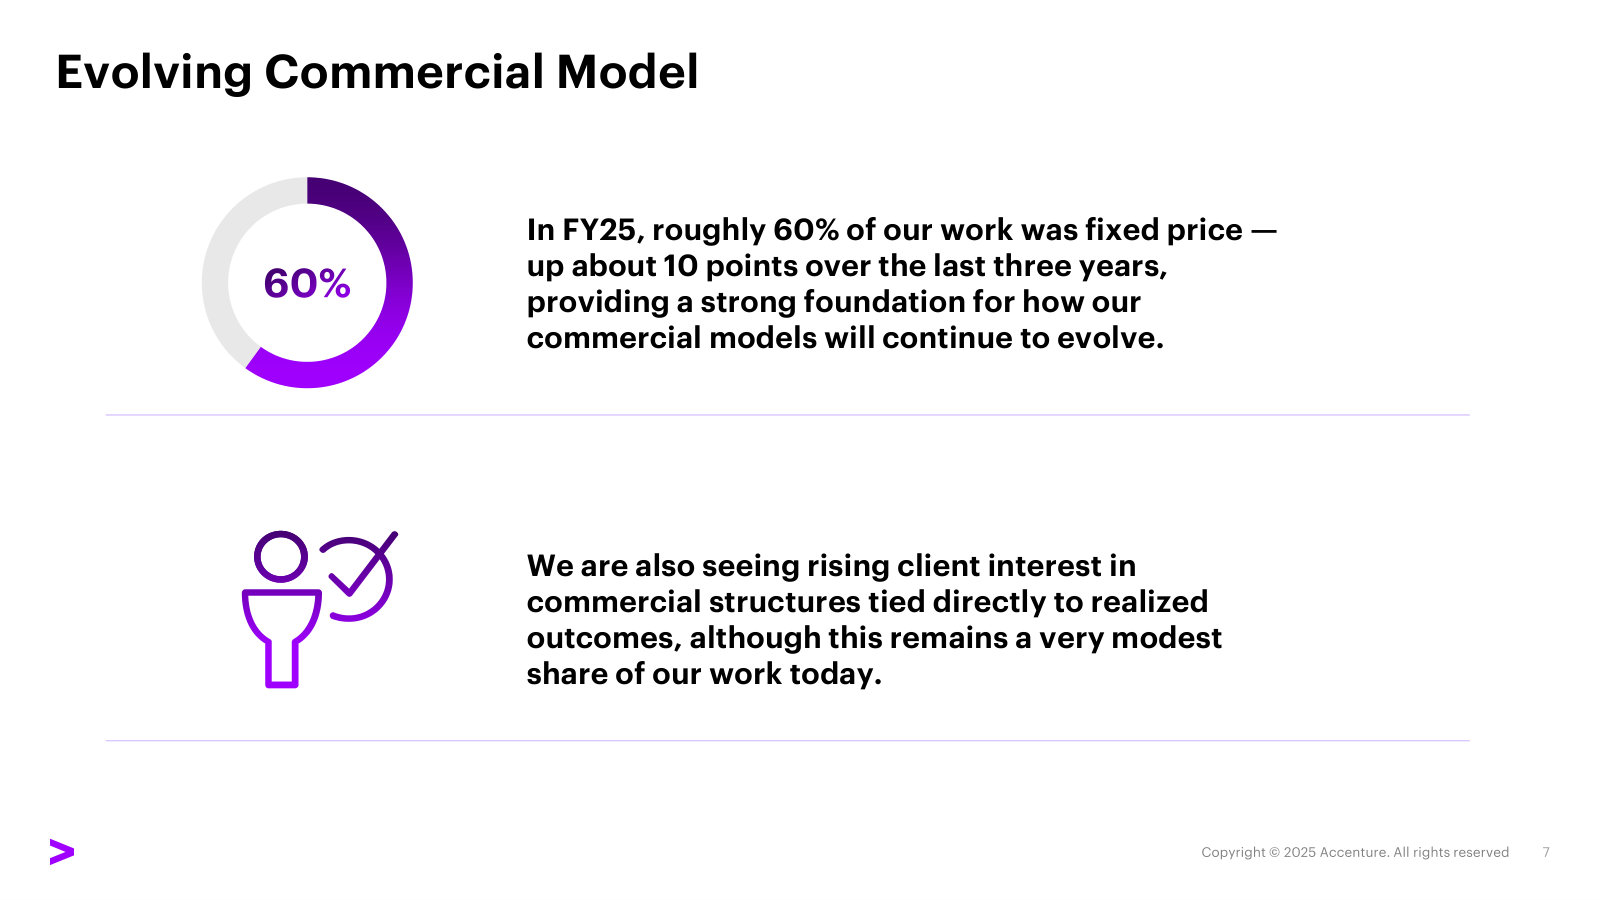
Q1 FY26 Earnings Presentation — Q1 FY26
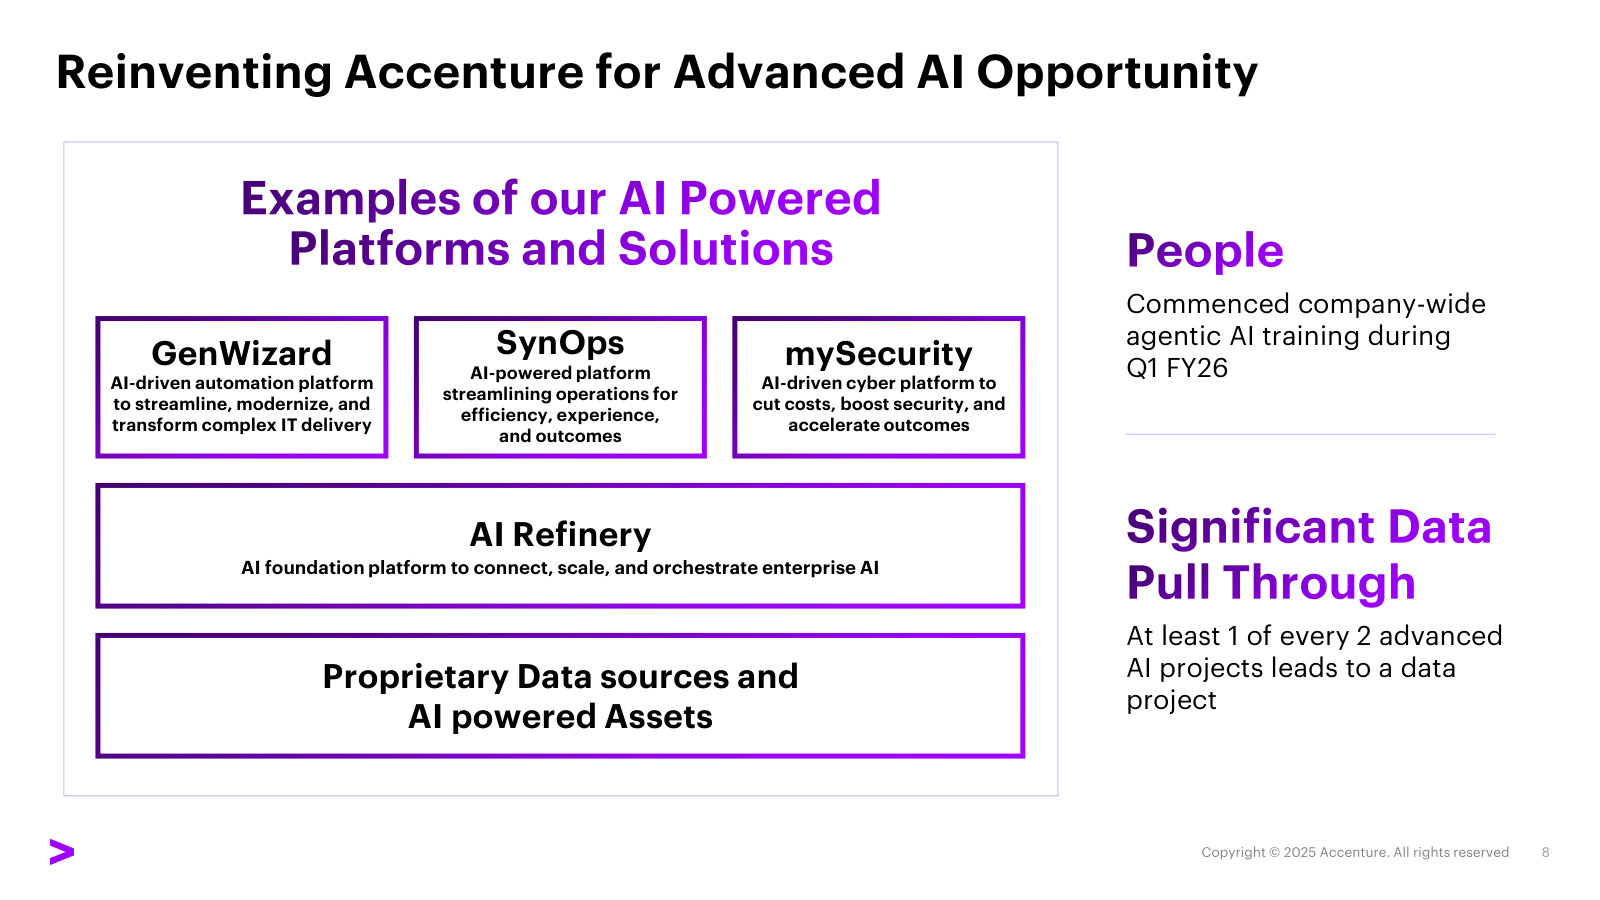
Featured for its explainers — the Song segment deep-dive, the AI product stack, the commercial-model shift and the AI business's scale. · Open the full document →
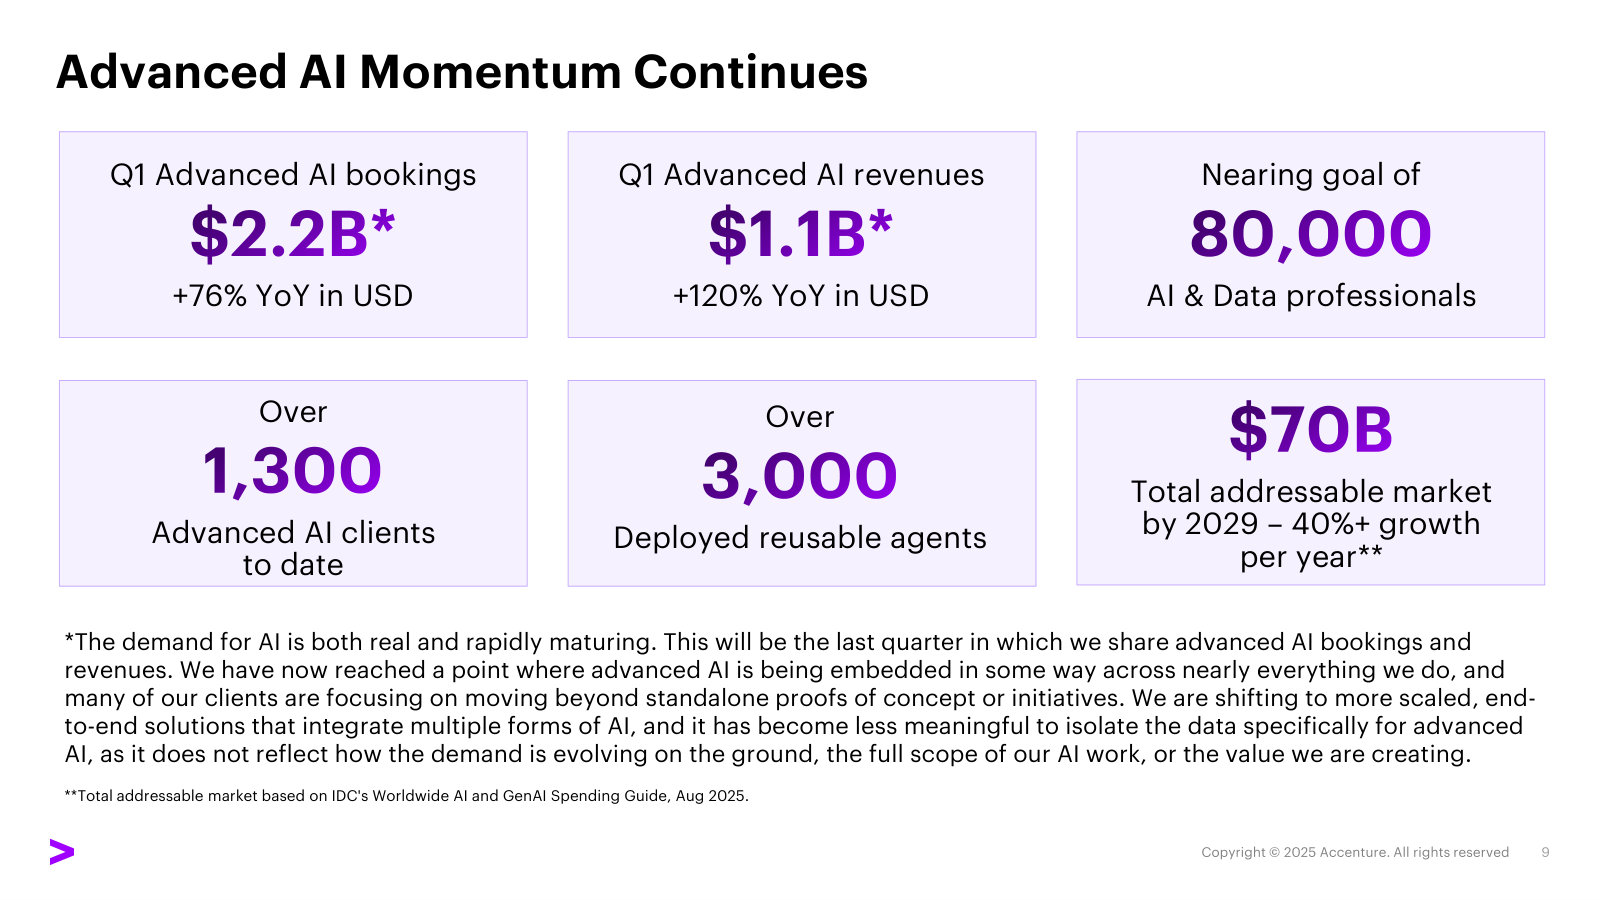
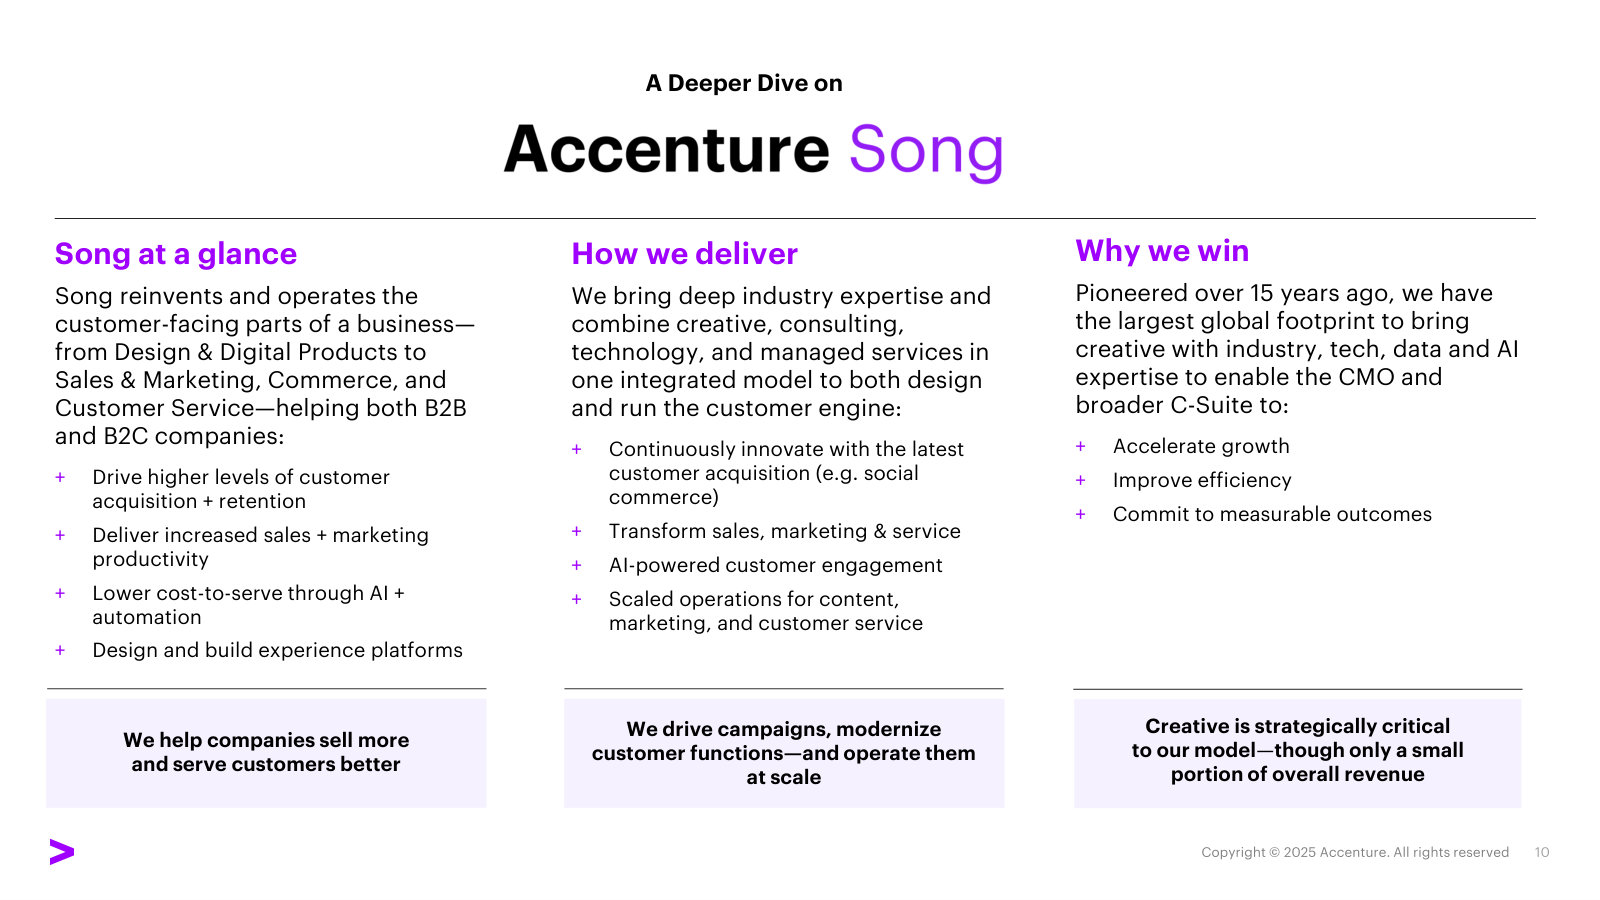
Q4 & Full-Year FY25 Earnings Presentation — FY25
The full-year deck: the cleanest annual snapshot of the business, plus the AI-investment and acquisition engine behind its growth. · Open the full document →
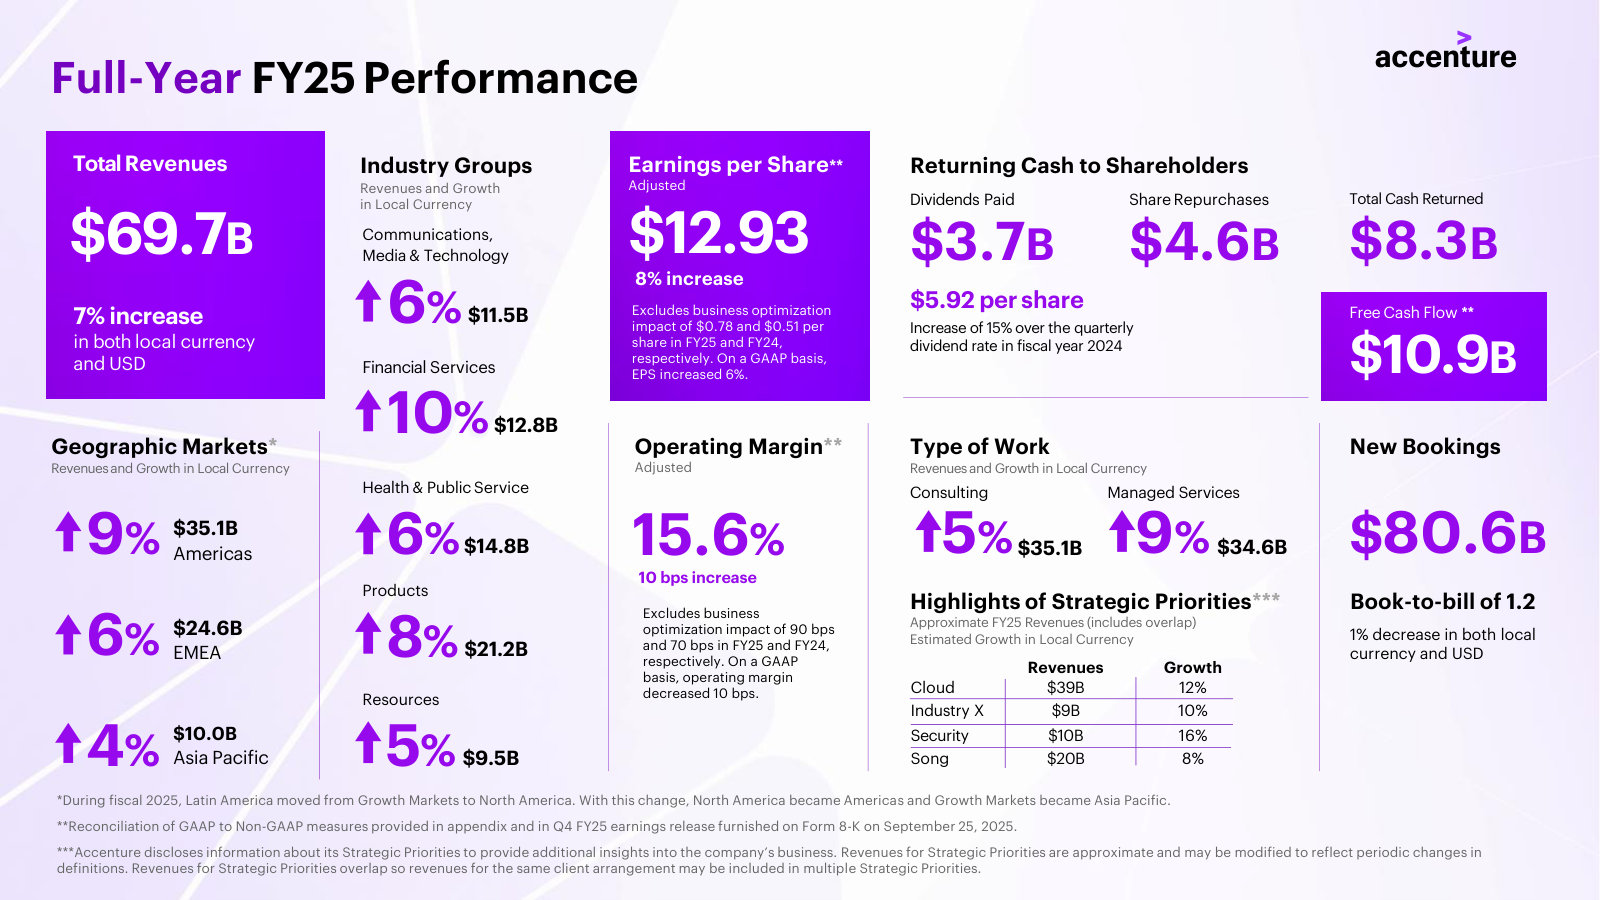
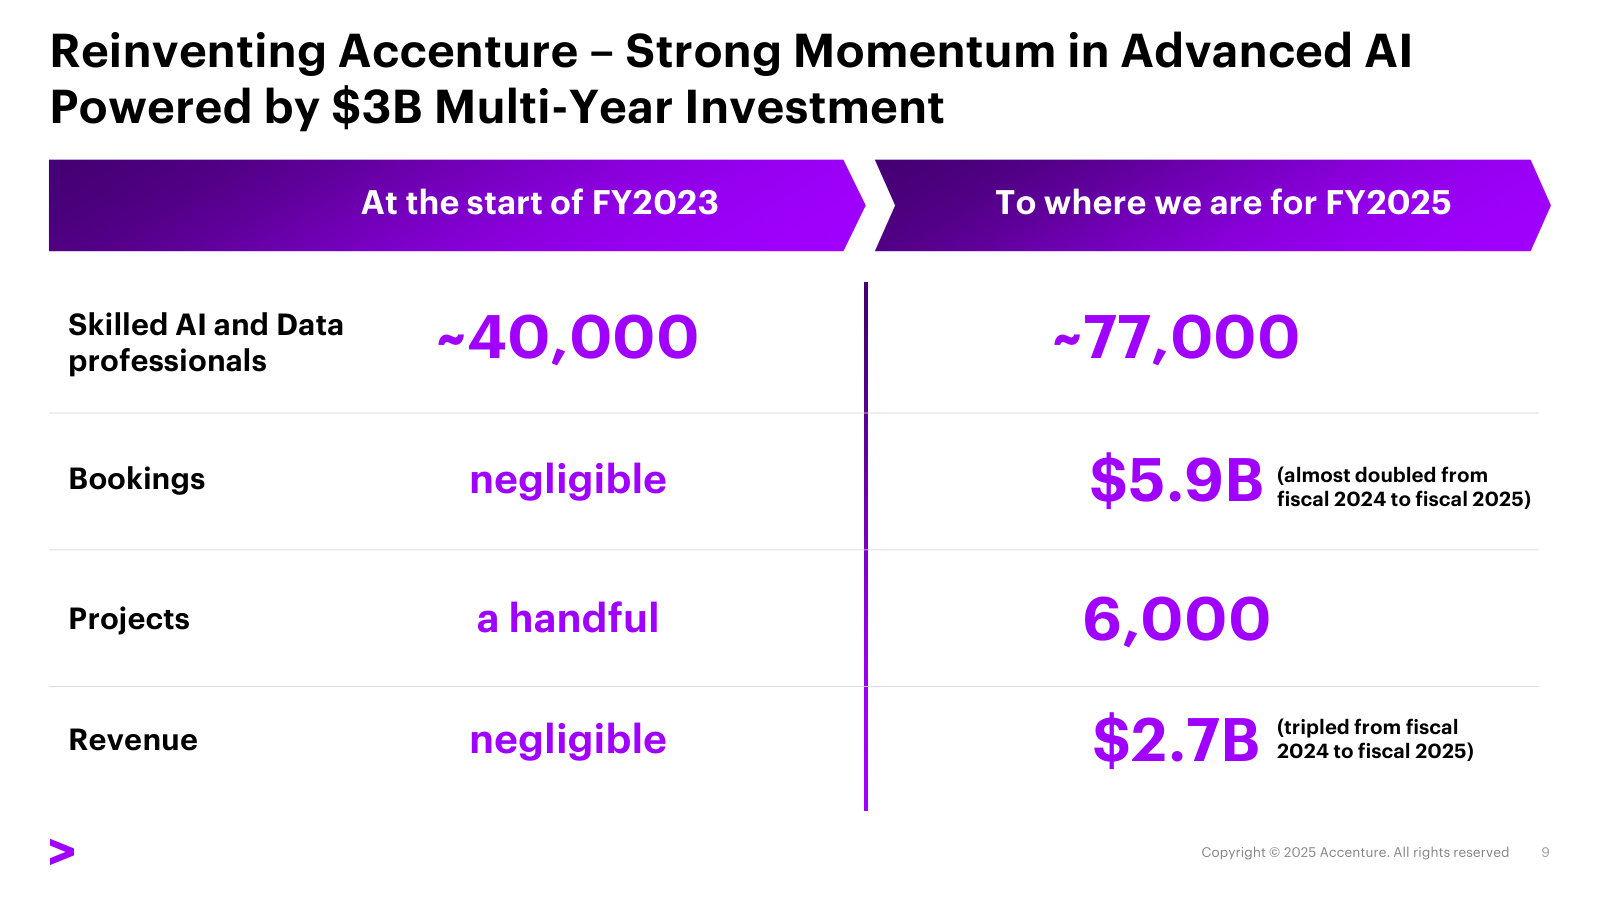
More from management
Q2 FY26 Earnings Presentation — Q2 FY26 · 24 pages · The prior quarter's deck: the CyberCX cybersecurity acquisition, first-half industry rankings, and Marc Warner's arrival as CTO. · Open →
Q4 & Full-Year FY24 Earnings Supplement — FY24 · 13 pages · FY24 full-year metrics — the prior-year baseline the FY25 growth figures are measured against. · Open →
Accenture plc's management answers for the business every quarter. These are the exchanges that explain it best — verbatim, from the call transcripts preserved in Sources. Each link opens the full transcript at that page in a new tab.
Q3 FY2026 Earnings Call — June 18, 2026
The most recent call: three OT-security acquisitions reframed as a bet on 'physical AI,' the mid-market pitched as a $240B new TAM, and management's answer to whether AI token spend is crowding out services budgets. · Open the full transcript →
The expansion playbook: security scaled from ~$700M to $10B (35% CAGR); OT-security and the $240B mid-market roughly triple the TAM.
Julie Sweet, Chair & CEO: We have grown our services organically and inorganically over the last decade from roughly $700 million in FY16 to $10 billion in fiscal 2025, a 35% CAGR over the period, 4 times that of Accenture’s over the same period. This investment more than triples our total addressable market in OT Security, which is growing double digit.
We are also expanding our total addressable market by going after a new, exciting customer segment: the mid-market. We estimate that the mid-market, which we look at as companies with between $300 million and $3 billion of revenue, is a $240 billion addressable market for us, growing high single-digits.
p. 5 · Read in context →
What 'AI ROI' means in dollars: lead accuracy from 13% to 97% — a production commercial engine, not a pilot.
Julie Sweet, Chair & CEO: Together with a leading large language model provider and hyperscaler, we built an AI engine that validates and enriches leads, generates personalized campaign content, and automates brand and legal validations. In B2B sales and marketing, conversion rates increased and drove net new revenue. Lead accuracy jumped from 13 percent to 97 percent. Campaign speed to market improved by 55 percent and marketing content teams are 40 percent more productive—with capacity freed to drive further growth.
This is what AI ROI looks like in practice—not a pilot, but a production-grade commercial engine delivering results at scale.
p. 10 · Read in context →
Why consulting is growing inside managed-services deals: 'This is not a technology play. It's a business play.'
Julie Sweet, Chair & CEO — in response to Jason Kupferberg (Wells Fargo): We've seen a three-quarter trend now of more consulting work in those large programs for managed services because our clients are asking us to help them use AI and change the processes to do more change management to really embed new ways of working, and so we're seeing that consulting grow in a lot of these larger deals that also include managed services, and it's a direct result of our strategy that says this is not a technology play. It's a business play.
p. 16 · Read in context →
Is AI token spend crowding out services budgets? A new FinOps-style optimization practice, and client budgets aren't rising.
Jim Schneider (Goldman Sachs); Julie Sweet, Chair & CEO: So Jim, one of the things we're clearly seeing, in fact, we have a whole practice that we're starting to grow now is on how to help clients optimize their use of tokens. It feels a lot like the cloud scenarios that we remember when people were moving to the cloud and then they were like, “oh, wait a minute, we're spending a lot more on the cloud than we thought” and we built a whole FinOps practice on helping optimize cloud. […] And at the same time, there's a certain amount of spending that's going to happen and so we're not seeing it be material to impact the spend on services today. […] Because the budgets haven't been, even with AI, they're spending it differently, but they haven't been increasing. And that's why moving into cyber security platform business, triples, more than triples our total addressable market in OT security. The mid-market is a massive TAM that we're now going to, and that's not been a focus of ours other than like generally.
So we are really focused on expanding our TAM while we're capturing more of the AI spend.
p. 18 · Read in context →
Q2 FY2026 Earnings Call — March 19, 2026
Agentic AI moves to center stage: management fields the sharpest bear case — that AI can cut an SAP migration to two weeks and shrink the systems-integration TAM — and explains why revenue has been decoupled from headcount since 2015. · Open the full transcript →
The 'car engine' analogy: better AI models don't map directly to bookings — they create the next opportunity, like agentic.
Julie Sweet, Chair & CEO — in response to Tien-Tsin Huang (JPMorgan): the models are basically just a super powerful engine. So if you think about the car, right, you've got this great engine, only if it's connected to everything, if it has wheels, so you can actually make it run and the transmission to guard it. And so, when the models come out, there isn't a direct correlation to bookings or new work. But what it does is create the next opportunity for us to look at what are the solutions that it's going to now create.
And so if you think about in earlier days, a lot of the work was focused on things like summarization and content creation, the better the models are, it's able to fuel things like moving into agentic
p. 15 · Read in context →
Where AI demand actually is: 78% of executives expect growth to be the biggest value, but efficiency still leads; agentic commerce surging.
Julie Sweet, Chair & CEO — in response to Tien-Tsin Huang (JPMorgan): the latest survey had 78% now saying we think growth is going to be the biggest value. That's not yet translating on-the-ground to being the biggest driver, mostly because of where the technology is. If you think about kind of the early days, a lot of it is about content, summarization, et cetera, that is really an eficiency play. And as the capabilities improve, you start to see more ability to take it into the core business and to do more complex work. So we are absolutely seeing an uptick in growth –growth-focused AI programs, but eficiency is still leading the way.
I will tell you that the most exciting area right now on growth is conversational and agentic commerce. Demand is surging there.
p. 16 · Read in context →
The labor-arbitrage bear case: revenue and headcount have not moved together since RPA arrived around 2015 — and that's in guidance.
Julie Sweet, Chair & CEO — in response to Darrin Peller (Wolfe Research): By linearity, if you mean the sort of revenue and headcount, I just would remind you that we really have not had a linear relationship since around 2015 when RPA, when automation really came in. And so we would expect to continue to see that, a disconnecting, and that's what's baked into our guidance.
p. 18 · Read in context →
Q4 & FY2025 Earnings Call — September 25, 2025
Full-year FY25 and a landmark reorganization: Accenture folds every capability into one 'Reinvention Services' unit, tripled GenAI revenue to $2.7B, and defends AI as expansionary rather than deflationary while a federal/DOGE headwind bites. · Open the full transcript →
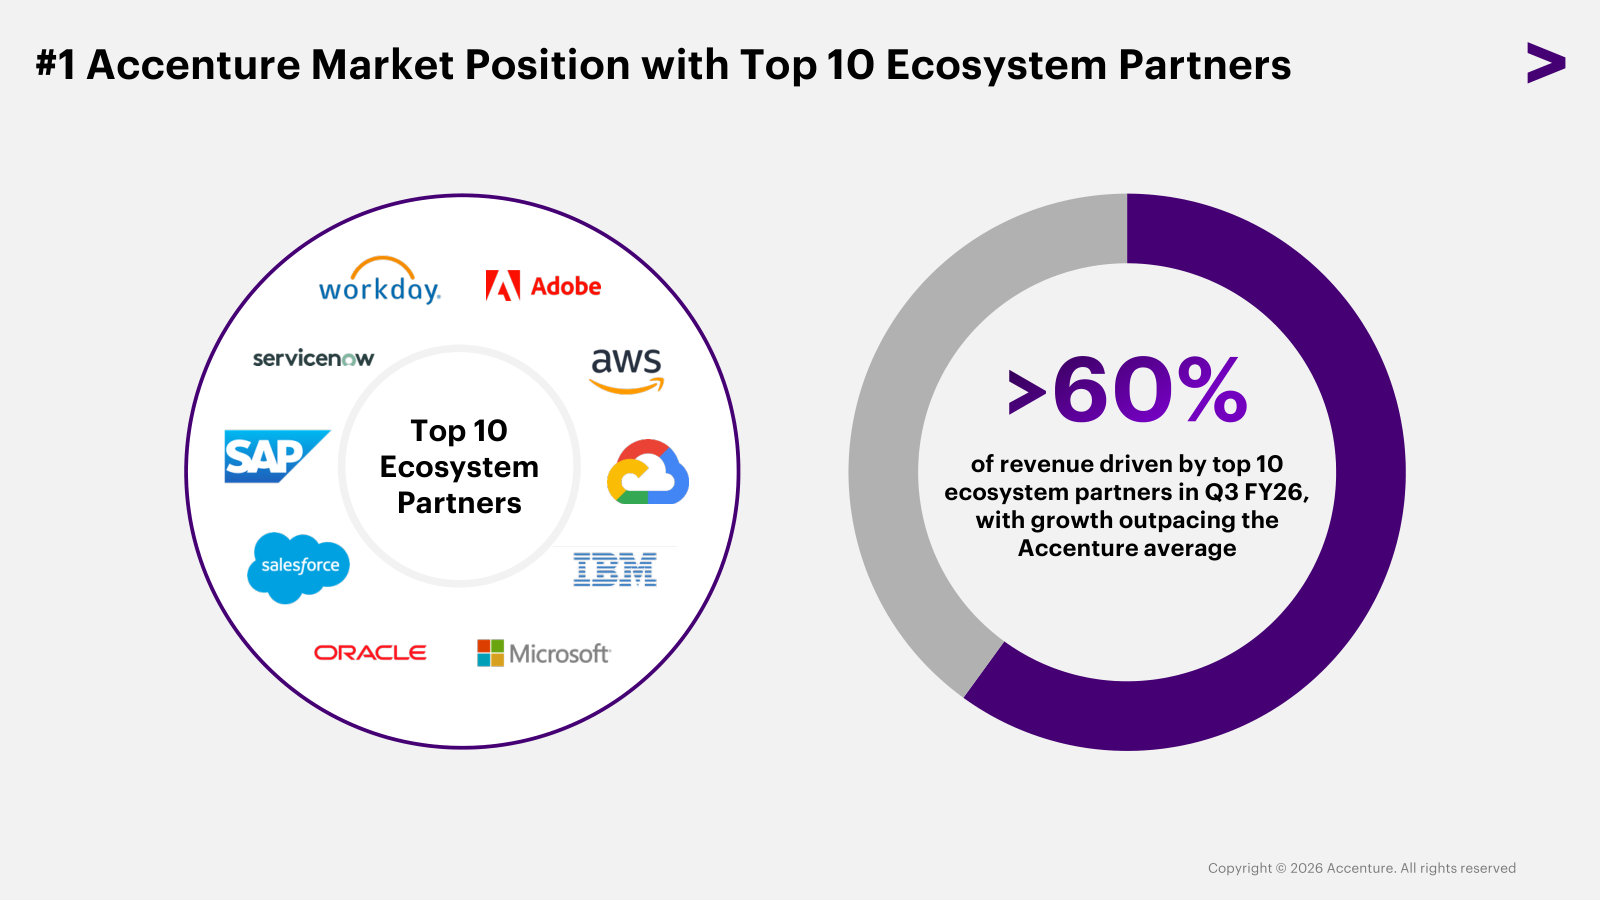
The economic engine: 60% of revenue runs through the top-10 tech partners (grew 9%); GenAI revenue tripled to $2.7B, bookings to $5.9B.
Julie Sweet, Chair & CEO: in FY25, we continued to be the number-one partner for all of our top 10 ecosystem partners by revenue. 60% of our revenue is from work that we do with these partners, which grew 9%, outpacing our overall revenue growth in FY25. […] In FY25, we tripled our revenue over FY24 from Gen AI and increasingly agentic AI to $2.7 billion. And we nearly doubled our Gen AI bookings to $5.9 billion.
p. 3 · Read in context →
The reorganization defined: on Sept 1 all capabilities fold into one 'reinvention services' unit; ~80% of large deals are multi-service.
Julie Sweet, Chair & CEO: Finally, our growth model. On September 1, we launched reinvention services, which brings all of Accenture's capabilities into a single unit. Nearly 80% of our large deals are multi-service. The model as we fully roll it out will make it faster and simpler to sell and deliver everything Accenture ofers and to rotate our oferings to embed more AI and data and equip our people.
p. 4 · Read in context →
Agentic AI in practice at Ecolab: nine agents redesign lead-to-cash; cash-application work goes from 100% manual to ~60% automated.
Julie Sweet, Chair & CEO: Instead of executing one-of use cases, we redesigned the entire lead to cash process, the steps from generating a lead to collecting payment using nine scaled agentic AI agents. These agents clean core data, resolve billing errors and automatically match customer payments to the right billing invoices. In cash application alone, work that used to be 100% manual is now about 60% automated, reducing errors and speeding up processes.
p. 11 · Read in context →
Capital allocation: at least $9.3B returned in FY26 (+12%), a 10% dividend raise, and $5B of new buyback authority.
Angie Park, CFO: We expect to return at least $9.3 billion through dividends and share repurchases, an increase of $1 billion or 12% from fiscal '25. Our Board of Directors declared a quarterly cash dividend of $1.63 per share to be paid on November 14, a 10% increase over last year and approved $5 billion of additional share repurchase authority. We remain committed to returning a substantial portion of our cash generated to shareholders.
p. 13 · Read in context →
The core bear case: is AI deflationary to revenue? Sweet: expansionary — client savings get reinvested into the next priorities.
Tien-Tsin Huang (JPMorgan); Julie Sweet, Chair & CEO: Do you see potential deflationary efects and how might that impact Accenture services both positively and negatively? Thanks. […] So we don't see AI as deflationary. We do see and are seeing it as expansionary similar to every tech evolution we've been through. The move from an analog to digital, from on-prem to cloud and SaaS, and is many of you who have been with us over the course of the years have known, in every successive tech evolution, we've become stronger.
And so if you look at AI, we see the same thing. Yes, AI absolutely boosts eficiency in areas like coding or operations, but those savings don't disappear. They're being reinvested into new priorities. The list of what our clients want to do with technology is truly virtually unlimited. And so when we can save them money by delivering our services with advanced AI, that frees up their budget to do the next things on their list
p. 14 · Read in context →
The federal drag pinned: the DOGE headwind anniversaries at the end of Q3 FY26; AFS is contracting mid-teens near-term.
David Koning (Baird); Angie Park, CFO: DOGE, are you expecting about a similar Q4 headwind through the first Q3 quarters of this year and then anniversary it in Q4 and then kind of going forward, maybe not having much impact at all? Is that kind of how you're modelling it?
## Angie Park
That's exactly right. We expect it to anniversary at the end of Q3.
p. 16 · Read in context →
Q2 FY2025 Earnings Call — March 20, 2025
The thesis tested: a new administration's efficiency drive and a GSA review of top-10 consulting firms hit Accenture Federal Services — 8% of global revenue — and analysts press management on exactly how much is at risk. · Open the full transcript →
The shock, sized: federal was 8% of global and 16% of Americas revenue; a GSA review told agencies to cut non-mission-critical contracts.
Julie Sweet, Chair & CEO: First, Accenture Federal Services. Federal represented approximately 8% of our global revenue and 16% of our Americas revenue in FY ‘24. As you know, the new administration has a clear goal to run the Federal government more efficiently. During this process, many new procurement actions have slowed, which is negatively impacting our sales and revenue. In addition, recently, the General Service Administration has instructed all federal agencies to review their contracts with the top 10 highest paid consulting firms contracting with the U.S. government, which includes Accenture Federal Services. The GSA's guidance was to terminate contracts that are not deemed mission critical by the relevant federal agencies.
p. 3 · Read in context →
The hardest question — 'the real revenue at risk?' Sweet declines to decompose it, folding slowdown and contract reviews into the range.
Tien-Tsin Huang (JPMorgan); Julie Sweet, Chair & CEO: Is there – maybe to ask it differently, just is there a way to frame the real revenue at risk? I know mission-critical is, maybe hard to define it here on the call, but is there anything that you can share in terms of what's really at risk or not at risk thinking about duration or is it really more of an issue of replenishing work, etc.? Just trying to get a better understanding of visibility there. Thank you.
## Julie Sweet
Sure. And so, Tien-Tsin, what I would say is, and what we've been clear about is the guided range we're giving for the quarter and for the year reflects our best view of the impact that's coming from both the slowing of new procurement actions and the assessments of the work that we're doing, and so we don't get into different pieces of it, but – those two things, the range of outcomes and that's reflected in the range.
I mean, it is 8% of our business. We have lots of other parts of our business that are about that size that we are always looking at estimates and assumptions.
p. 13 · Read in context →
Guidance philosophy: the top of the range doesn't need discretionary spend to improve; the bottom allows for further deterioration.
Julie Sweet, Chair & CEO; Angie Park, CFO — in response to Bryan Keane (Deutsche Bank): as we went into this calendar year, we did not see kind of – like kind of across the board a meaningful increase in budgets for our services. So we saw more of the same, […] discretionary spending this quarter, Q2 was overall about the same, still constrained. There were some pockets of improvement, for example, in banking and capital markets in the Americas, but again, going into the calendar year, discretionary spending was overall about the same constraint, and particularly in small deals that we've been seeing. […] I would just add that as you think about our guidance for the full year as well, and what it assumes is discretionary spend does not have to improve at the top end of the range, while it continues to allow for further deterioration at the bottom.
p. 14 · Read in context →
Q4 & FY2024 Earnings Call — September 26, 2024
The year GenAI became a real revenue line: $3B in new bookings and ~$900M revenue, up from ~$300M/$100M a year earlier — and management explains, deal by deal, how the money is actually made. · Open the full transcript →
The genesis number: $3B of new GenAI bookings and nearly $900M of revenue in FY24, up from ~$300M/$100M in FY23.
Julie Sweet, Chair & CEO: For the ful fiscal year, we had $3 billion in new GenAI bookings, including $1 billion in Q4 and for the full fiscal year, we had nearly $900 million in revenue. The magnitude of this achievement is seen in the comparison to FY 2023 where we had approximately $300 million in sales and roughly $100 million in revenue from GenAI. This was an area where our clients continued to buy small deals and we focused on accelerating our growth here.
p. 3 · Read in context →
The acquisition engine: ~75% of deals sole-sourced, integration as the moat — M&A done 'ultimately to drive our organic growth.'
Julie Sweet, Chair & CEO: Over the last decade, we have built a finely tuned acquisition capability, becoming known in the market as a good home with approximately 75%, on average, of our acquisitions sole sourced. While our ability to identify and evaluate our acquisitions is critical, it is our ability to integrate them successfully that has made our acquisition capability so formidable. […] As a reminder, we do acquisitions ultimately to drive our organic growth. Our global footprint, deep client relationships across industries, as well as strong ecosystem gives us a unique perspective on growth opportunities. We use acquisitions to scale quickly in growth areas, to build new skills in adjacent markets and to deepen our technology, industry and functional expertise.
p. 10 · Read in context →
How the money is made: deals move from proof-of-concept to scaled implementations, and every other one pulls through data-readiness work.
Julie Sweet, Chair & CEO — in response to Bryan Keane (Deutsche Bank): So, yes, so we ended with $3 billion bookings for the year, and we'd expect in FY 2025 another healthy increase. There is clear demand. We're starting to see more of our clients move from proofs of concept to sort of larger implementations which is important. So the size of those bookings is clicking up and also, we're continuing to see kind of at least every other one has got data pull through […] because one of the biggest limitations on using GenAI today and why it's going to take a while is it needs data, and our clients have a lot of work to do on data which is of course a big opportunity for us.
p. 17 · Read in context →
The two-engine bookings model: management targets Consulting book-to-bill ≥1.0 and Managed Services ≥1.2 over trailing four quarters.
Angie Park, CFO — in response to Keith Bachman (BMO): In terms of the way to think about our bookings, we were super pleased with the $81 billion of bookings that we had for the year, which was 14% growth, which included the 125 quarterly client bookings over $100 million […] For us, over time, over four trailing quarters, we're always looking for our Consulting book-to-bill to be 1.0 or better and for our Managed Services to be 1.2 or better and nothing has changed there.
p. 17 · Read in context →
The hardest question — deal sizes and productivity: sub-$1M GenAI deals now reach $10M+; the gains show first in Managed Services.
Bryan Bergin (TD Cowen); Julie Sweet, Chair & CEO: I don't want to start giving tons of data on this but you went from deals that were in GenAI that were on average kind of sub-$1million, that you've now got some that are above $10 million, so that's still the smaller end, because you're sort of moving into production and scale […] in our Managed Services is where we're seeing the most because that's where we have platforms so you all remember we used to talk about myWizard and now we talk about Gen Wizard but what we're seeing is that the technology and the productivity is like similar ways before.
p. 21 · Read in context →
More calls
Q1 FY2026 Earnings Call — December 18, 2025 · 23 pages · The quarter Accenture retired its pioneering advanced-AI bookings metric (~$11.5B cumulative across 11,000 projects) — and Sweet's blunt 'I'm not waiting around' rebuttal to the discretionary-spend recovery question. · Open →
Q3 FY2025 Earnings Call — June 20, 2025 · 21 pages · Where the 'Reinvention Services' reorganization was first announced (effective Sept 1), framed against the 2013 and 2020 growth-model resets, as the federal/DOGE drag began to bite. · Open →
Q1 FY2025 Earnings Call — December 19, 2024 · 22 pages · The 'strategy is working' inflection: the widest revenue beat in ~two years on the pivot to mega-deals, plus the first framing of new-administration federal exposure (~8% of revenue) and the completed $5B inaugural bond. · Open →
Q3 FY2024 Earnings Call — June 20, 2024 · 23 pages · The CFO-transition call (KC McClure to Angie Park) and a GenAI milestone — $2B YTD bookings, ~$500M revenue — with Sweet's clearest 'AI is a small part of what's needed' catalyst argument. · Open →
Q2 FY2024 Earnings Call — March 21, 2024 · 23 pages · The 'corporates have put themselves on a diet' call — the sharpest read on the discretionary-spend downturn — and the $1B LearnVantage/Udacity upskilling bet. · Open →
Q1 FY2024 Earnings Call — December 19, 2023 · 25 pages · The GenAI ramp narrative ($450M booked in a single quarter vs. ~$300M in all of FY23), framed as the shift 'from experimentation to scale,' plus a candid U.K.-weakness call-out. · Open →
Q4 & FY2023 Earnings Call — September 28, 2023 · 22 pages · The FY23 wrap — record $72B bookings, $9B free cash flow, a 12% local-currency decline in CMT — and the first framing of the $3B, three-year AI investment. · Open →
Q4 & FY2021 Earnings Call — September 23, 2021 · 34 pages · The boom-year capstone (pre-GenAI): Cloud First driving cloud from $12B to $18B, $4.2B across 46 acquisitions, and the Industry X 'next digital frontier' thesis. Motley Fool transcript — messy formatting, dated segment terms. · Open →
Accenture plc's annual reports contain management's most considered account of the business. These are the sections, passages and visual pages worth opening in the originals preserved in Sources.
Accenture plc — FY2025 Annual Report (Form 10-K) — FY2025 (year ended Aug 31, 2025)
Latest 10-K: $69.7B revenue, the Sept 2025 fold into one 'Reinvention Services' unit, and AI/federal-spending crosscurrents. · Open the full document →
Item 1. Business — p. 22 · Read the full section →
How Accenture defines itself: a labor-plus-AI reinvention partner sold by industry across three geographies and two work types.
The self-definition: ~779,000 people, three markets, five industry groups, two types of work.
Accenture is a leading solutions and global professional services company that helps the world’s leading enterprises reinvent by building their digital core and unleashing the power of AI to create value at speed across the enterprise, bringing together the talent of our approximately 779,000 people, our proprietary assets and platforms, and deep ecosystem relationships. Our strategy is to be the reinvention partner of choice for our clients and to be the most AI-enabled, client-focused, great place to work in the world. […] We serve clients and manage our business through three geographic markets: Americas, EMEA (Europe, Middle East and Africa) and Asia Pacific. These markets bring together all of our Reinvention Services with both local and global talent and solutions.
We go to market by industry, leveraging our deep expertise across our five industry groups— Communications, Media & Technology, Financial Services, Health & Public Service, Products and Resources. We deliver two types of work: Consulting and Managed Services.
p. 22 · Read in context →
The FY2025 evolution: all services folded into one 'Reinvention Services' unit effective Sept 1, 2025.
Effective September 1, 2025, we brought all of our services, which are described below, together into a single, integrated business unit called Reinvention Services. […] With the majority of our large deals today already involving capabilities across multiple areas, the full rollout of our model is designed to make it faster and simpler to sell and deliver everything Accenture offers across our client base, while embedding more AI and data and equipping our people.
p. 23 · Read in context →
Item 1A. Risk Factors — p. 31 · Read the full section →
The two risks most specific to a labor-arbitrage firm: AI cannibalizing its own billable work, and matching skills to shifting demand.
Item 7. Management's Discussion and Analysis — p. 51 · Read the full section →
Management on what drove results: 7% growth split evenly Consulting/Managed Services, and a real federal (AFS) headwind.
Named headwind: DOGE-driven federal cuts hitting Accenture Federal Services via delayed procurements, price/scope cuts and terminations.
In addition, the U.S. administration is reducing federal spending and the size of the federal workforce under the guidance of the Department of Government Efficiency. We are seeing impacts from these efforts in our federal government business (“Accenture Federal Services, or AFS”), including delays in new procurements, reductions in price and contract scope, and contract terminations. These changes have had an adverse effect on AFS’s results and could in the future have a material impact on our results of operations or financial condition.
p. 51 · Read in context →
Note 1. Summary of Significant Accounting Policies — Revenue Recognition — p. 85 · Read the full section →
The accounting that defines the model: how ~50/50 multi-year Managed Services vs. cost-to-complete Technology Integration revenue is booked.
Two revenue engines: managed services recognized over multi-year terms; technology integration on costs-incurred-to-total-cost progress.
Our managed services contracts typically span several years. Revenues are generally recognized on managed services contracts over time because our clients benefit from the services as they are performed. […] Revenues from contracts for technology integration consulting services where we design/redesign, build and implement new or enhanced systems and related processes for our clients are recognized over time as control of the system is transferred continuously to the client. Contracts for technology integration consulting services generally span six months to two years. Revenue, including estimated fees, is recognized using costs incurred to date relative to total estimated costs at completion to measure progress toward satisfying our performance obligations.
p. 86 · Read in context →
Note 16. Segment Reporting — p. 117 · Read the full section →
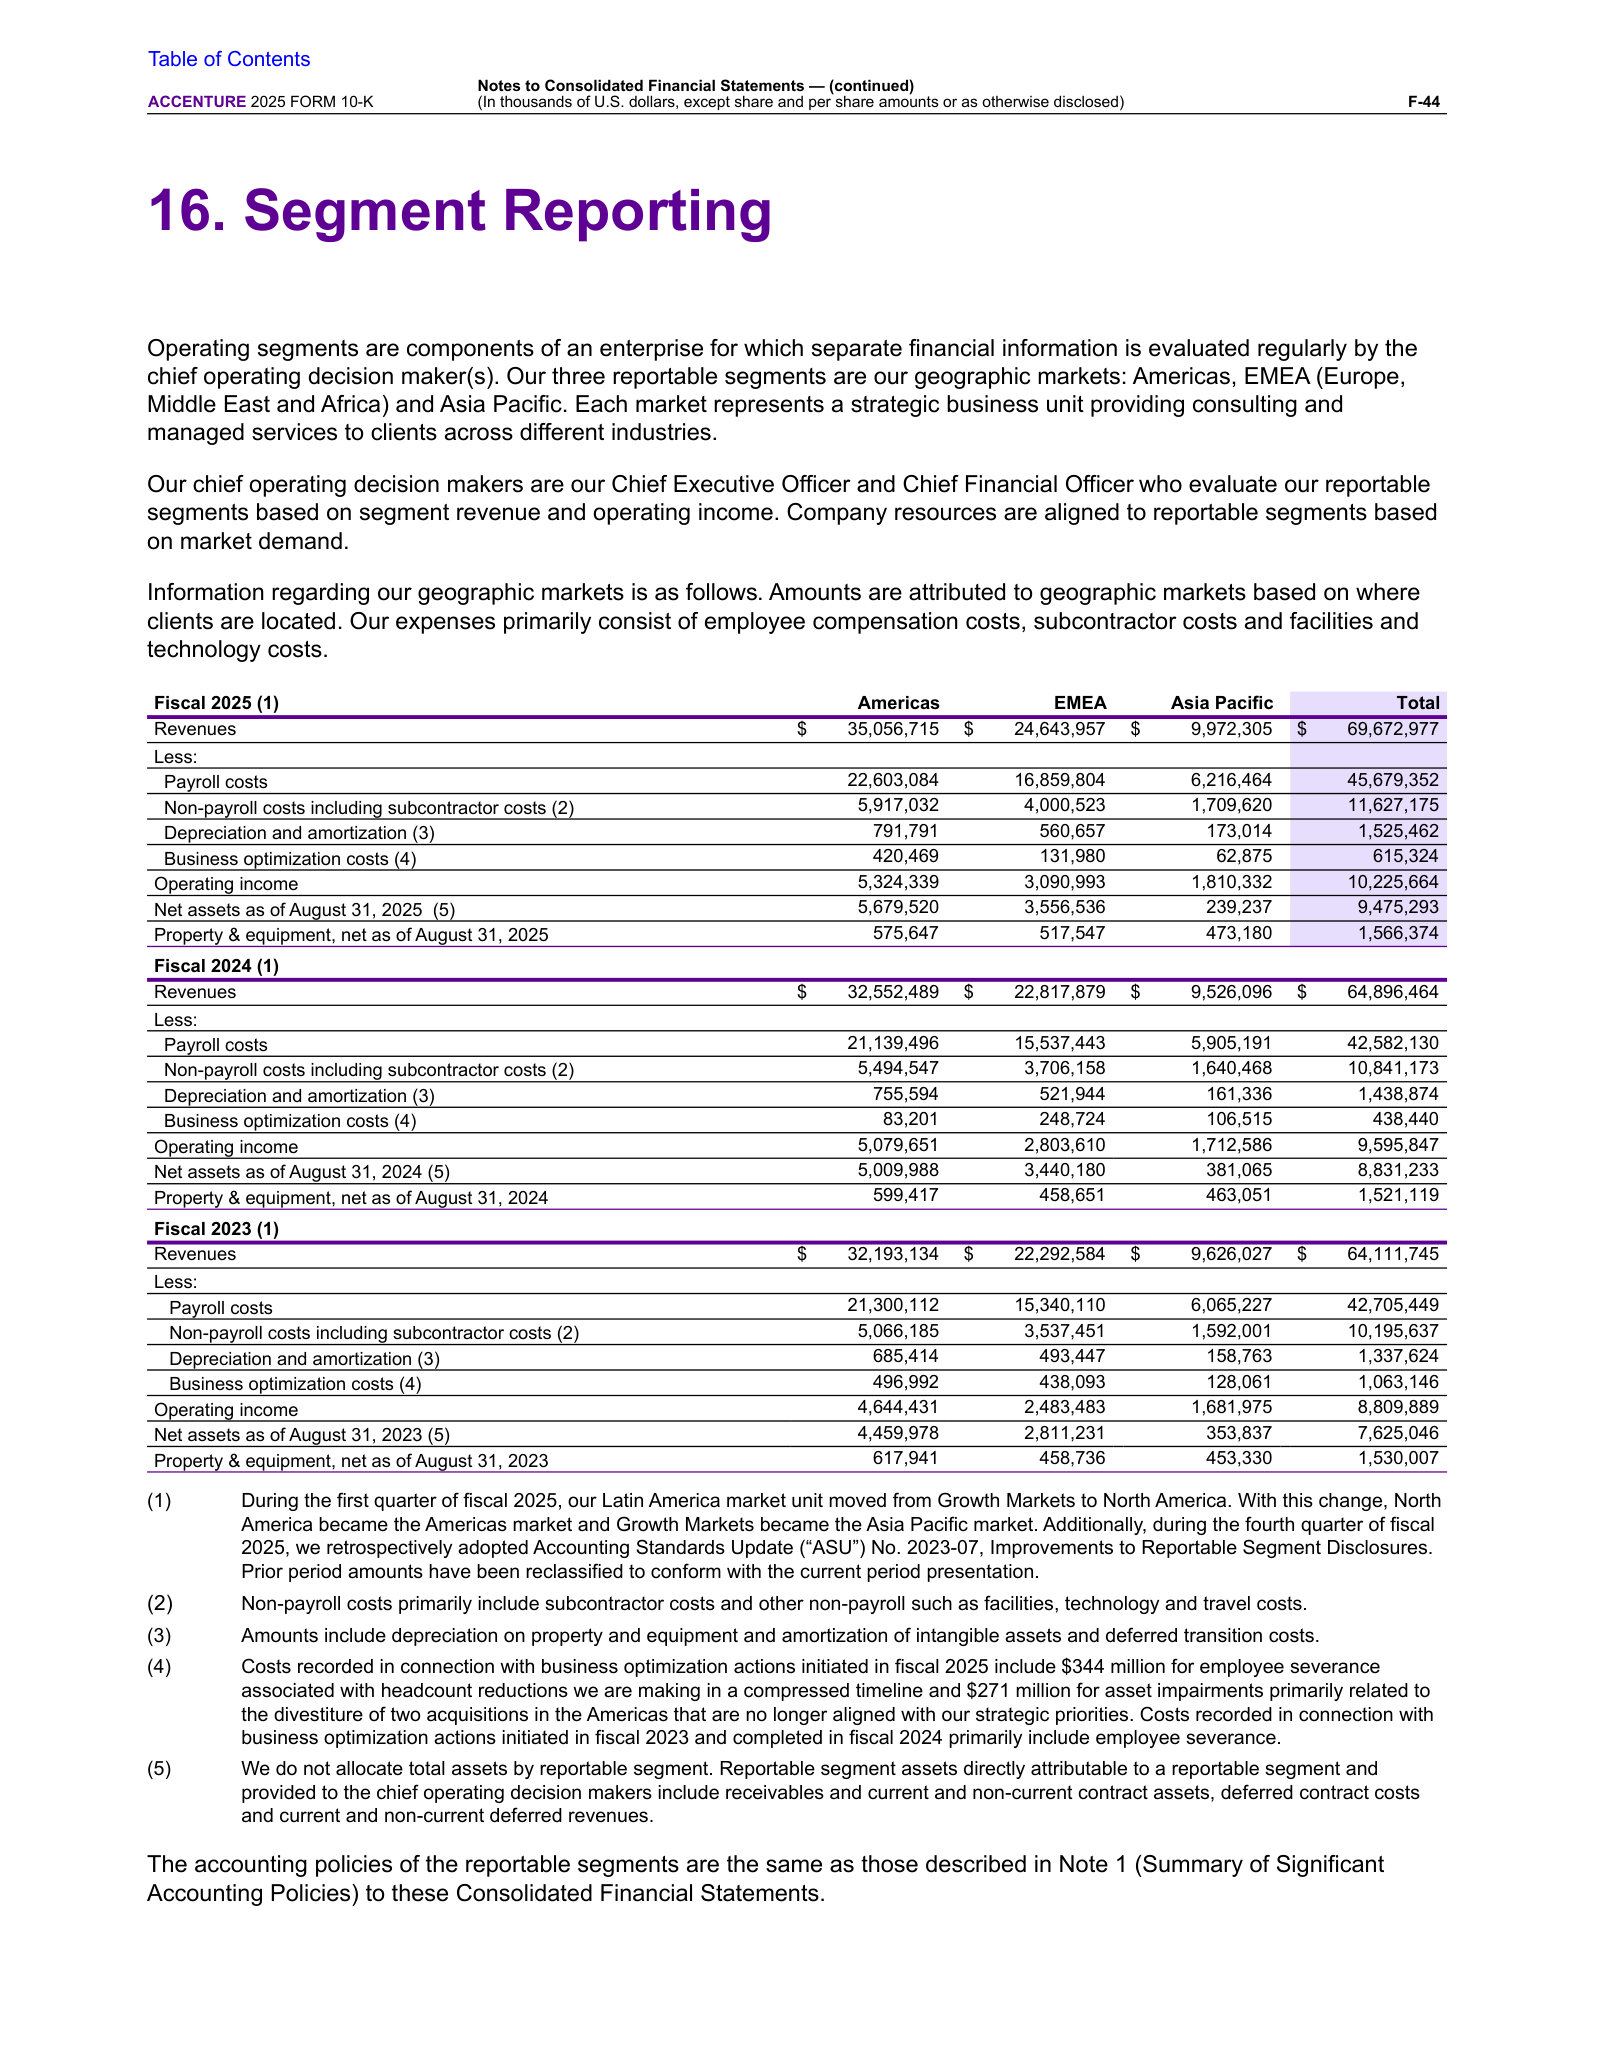
The only audited segment view: Americas/EMEA/Asia Pacific revenue and operating income, with payroll the dominant cost line.
More annual reports
Accenture plc — FY2024 Annual Report (Form 10-K) — FY2024 (year ended Aug 31, 2024) · 123 pages · Prior year: the pre-'Reinvention Services' structure with services still described separately and the earlier geographic-market taxonomy. · Open →
Accenture plc — FY2023 Annual Report (Form 10-K) — FY2023 (year ended Aug 31, 2023) · 119 pages · The year Accenture announced its $3B multi-year generative-AI investment and a large business-optimization/severance program. · Open →
Accenture plc — FY2022 Annual Report (Form 10-K) — FY2022 (year ended Aug 31, 2022) · 99 pages · Peak post-pandemic growth year — useful baseline before the 2023 demand normalization and AI pivot. · Open →
Accenture plc — FY2021 Annual Report (Form 10-K) — FY2021 (year ended Aug 31, 2021) · 102 pages · Earliest edition on the shelf; shows the services taxonomy and disclosures four years before the FY2025 reorganization. · Open →
Accenture plc — FY2025 360° Value Report — FY2025 · 69 pages · Companion ESG/value report expanding the 10-K's '360° value' framing — people, client, and sustainability metrics. · Open →
Competitors describe Accenture plc's market in their own filings and calls. These verified passages and visual pages show where their strategies meet, using source documents preserved in Sources.
Cognizant (CTSH)
The closest US-listed, near-pure-play IT-services competitor to Accenture; its 10-K names Accenture first among direct competitors, and it reports the same bookings, large-deal TCV and GenAI-adoption metrics Accenture is measured on.
In its FY2025 10-K competition section, Cognizant lists Accenture first among its named direct competitors in what it calls a highly competitive market.
Our direct competitors include, among others, Accenture, Atos, Capgemini, CGI, Deloitte Digital, DXC Technology, EPAM Systems, Genpact, HCL Technologies, IBM Consulting, Infosys Technologies, Tata Consultancy Services and Wipro.
p. 18 · Read in context →
Cognizant reports Q1 FY2026 bookings up 21% year-over-year with seven $100M-plus large deals and a pending managed-services acquisition — the bookings and large-deal cadence tracked against Accenture's.
Ravi Kumar S, Chief Executive Officer: Q1 bookings grew 21% year-over-year. We signed 7 large deals with TCV of $100 million or greater, including 1 mega deal valued at more than $500 million. […] we just announced a definitive agreement to acquire Atria, a global IT managed services provider
p. 1 · Read in context →
Cognizant's stated AI-adoption penetration across its key accounts — a read on the generative-AI demand it and Accenture are both pursuing.
Ravi Kumar S, Chief Executive Officer: out of a subset of a client base of nearly 360 key accounts, 97% of clients have adopted AI, of which 56% are scaling Gen AI and out of which 78% have demonstrated impact from the adoption and scaling.
p. 2 · Read in context →
IBM (IBM)
IBM Consulting is Accenture's direct rival in consulting and systems integration; IBM's 10-K names Accenture first among Consulting competitors, and it reports a generative-AI 'book of business' comparable to Accenture's GenAI bookings.
IBM's FY2025 10-K names Accenture first among IBM Consulting's competitors in a market spanning consulting, systems integration and application services.
Consulting operates in a highly competitive, dynamic market that spans business consulting, systems integration, application development and management, and business process outsourcing services. Our competitors include global firm such as Accenture, Capgemini, India-based service providers, management consulting firms, the consulting practices of public accounting firms, engineering service providers, and niche specialists.
p. 6 · Read in context →
IBM quantifies its inception-to-date generative-AI 'book of business' at over $12.5bn, with more than $10.5bn in Consulting — the enterprise-AI pipeline directly comparable to Accenture's reported GenAI bookings.
Arvind Krishna, Chairman and Chief Executive Officer: Our cumulative Gen AI book of business now stands at over $12.5 billion, of which software is more than $2 billion and consulting is more than $10.5 billion, with both seeing their largest quarterly increase to date.
p. 2 · Read in context →
IBM's CFO benchmarks its multi-billion-dollar Consulting GenAI book 'against any consulting company', framing IBM's integrated tech-plus-consulting model versus pure consulting rivals like Accenture.
James Kavanaugh, Chief Financial Officer: north of a $7.5 billion book of business I'd put that up against any consulting company right now. […] We do think we have a differentiated competitive value proposition of a company with an integrated tech stack plus strategic partnership AI plus a consulting business
p. 7 · Read in context →
Tata Consultancy Services (TCS)
Accenture's closest global-scale rival by headcount and delivery footprint; TCS reports order-book TCV, an enterprise-AI thesis and a workforce that map onto the same metrics Accenture is judged by.
TCS reports FY2026 order-book TCV of $40.7bn and casts itself as the trusted end-to-end 'System Integrator' — the enterprise-transformation role Accenture also fills.
K Krithivasan, Chief Executive Officer: even though our FY 2026 revenue declined by 2.4% in constant currency, we delivered a strong $40.7B in TCV including 5 mega deals. […] the role of trusted System Integrators has become even more vital. Clients are looking for partners who can bring deep technology excellence, strong enterprise and industry context, and take end-to-end accountability with confidence on outcomes and ROI.
p. 5 · Read in context →
TCS's read on the enterprise-AI market — adoption still early, with 95% of enterprises in initial phases — framing the runway it and Accenture both target.
While awareness is high, AI adoption remains at an early stage, with 95% of enterprises still in the initial phases of their AI journey. This leaves significant room for growth, scale and transformation across industries.
p. 11 · Read in context →
TCS reports a global headcount of 584,519 — a direct scale comparison with Accenture's workforce of roughly 800,000.
Sudeep Kunnumal, Chief Human Resources Officer: At the end of March 2026, our global headcount stood at 584,519, with associates from 149 nationalities of whom 35.2% are women.
p. 13 · Read in context →
Infosys (INFY)
A top-tier global IT-services competitor to Accenture in digital transformation, cloud and enterprise AI; Infosys reports large-deal TCV and an AI-services market thesis on the same terms Accenture uses.
Infosys reports FY2026 large-deal TCV of $14.9bn (up 28%) and positions its Topaz AI and Cobalt cloud platforms against a large AI-services market — the enterprise-AI demand Accenture also pursues.
Salil Parekh, Chief Executive Officer and Managing Director: Large deals were very good, $14.9 bn for the full year, $3.2 bn for the fourth quarter. The full year was 28% higher than it was in the previous year. […] We see a large addressable market for AI services across the six areas that we mentioned - AI strategy engineering, data, process, legacy modernization, physical AI and trust.
p. 4 · Read in context →
Infosys sizes the enterprise-AI-services opportunity at US$300bn and reports AI-led programs deployed across 90% of its top 200 clients.
Infosys is emerging as a leader in AI services, with AI-led programs now deployed across 90% of our top 200 clients and rapidly scaling across industries. […] together addressing a US$300 billion opportunity, based on market estimates.
p. 19 · Read in context →
Infosys details its FY2026 bookings — 96 large deals, $15bn TCV, 55% net-new, three mega deals — the deal-mix disclosure comparable to Accenture's new-bookings reporting.
Jayesh Sanghrajka, Chief Financial Officer: In FY26, we signed 96 large deals with TCV of $15 bn, 55% net new. This includes 3 mega deals for the year.
p. 29 · Read in context →
Capgemini (CAP)
Accenture's largest Europe-headquartered competitor in consulting, technology and engineering services; Capgemini sizes the shared market, names Accenture as its lead regional competitor, and reports comparable bookings and GenAI order intake.
Capgemini sizes its addressable transformation-and-engineering (ER&D) market at about $1.8 trillion; in the same section its regional competitor panels list Accenture first. (French-language filing.)
Ensemble, ces marchés sont estimés à 1,8 trillion (1) de dollars et affichent tous deux des taux de croissance solides à un chiffre
p. 16 · Read in context →
Capgemini reports FY2025 bookings of €24.4bn at a 1.08 book-to-bill and discloses that generative-AI-related bookings exceeded 8% of Group bookings (over 10% in Q4) — the GenAI-demand signal Accenture also reports. (French-language filing.)
Les prises de commandes se sont élevées à 24 356 millions d’euros en 2025 et 7 202 millions d’euros au quatrième trimestre. Cela reflète une dynamique commerciale soutenue, avec un ratio « book-to-bill » solide de 1,08 sur l’année et de 1,21 sur le quatrième trimestre. […] Les prises de commandes relatives à l’IA générative ont représenté plus de 8 % des prises de commandes du Groupe en 2025, et plus de 10 % au quatrième trimestre
p. 338 · Read in context →
Wipro (WIPRO)
A global IT-services competitor to Accenture across cloud, digital and enterprise AI, with a consulting arm (Capco); Wipro reports large-deal bookings and sizes the same IT-services market Accenture serves.
Wipro reports Q1 FY2026 total-contract-value bookings of $5bn (up 51%) and large-deal bookings of $2.7bn (up 131%), several driven by vendor consolidation — the deal momentum tracked against Accenture.
Srini Pallia, Chief Executive Officer and Managing Director: During the quarter, we reported bookings worth $5 billion in total contract value, a growth of 51% year-on-year. Our large deal bookings reached $2.7 billion, up 131% year-on-year. This includes 16 large deals this quarter, including 2 mega deals. Several of these wins were driven by vendor consolidation.
p. 4 · Read in context →
Wipro's sizing of the shared market: global IT-services spending up 4.6% in CY2025 (citing NASSCOM), driven by AI industrialization, cloud and cybersecurity — the demand pool Accenture competes for.
global IT services spending grew year-over-year by 4.6% in calendar year 2025 despite macroeconomic uncertainty and muted enterprise budgets. Growth was driven by the industrialization of AI, continued digital and cloud transformation, and sustained demand for cybersecurity and data services
p. 35 · Read in context →
More peer documents
Q4_FY2025 — 14 pages · Cognizant's FY2025 wrap-up — full-year bookings, large-deal totals and forward guidance to trend against Accenture. · Open →
Q3_FY2025 — 12 pages · Large-deal cadence (16 YTD large deals, TCV up 40% year-on-year) and 350,000-associate headcount scale. · Open →
Q1_FY2026 — 13 pages · Most-recent-quarter read on IBM Consulting and the generative-AI book of business after the $12.5bn exit. · Open →
IBM_annual_report_FY2024 — 50 pages · Prior-year 10-K Consulting competition disclosure — also names Accenture first — for a year-over-year read. · Open →
Q3_FY2026 — 33 pages · YTD order book ($28–29bn) and per-vertical TCV detail for the demand/market-share trajectory. · Open →
Q3_FY2026 — 64 pages · Infosys AI Investor Day — Topaz Fabric and enterprise-AI 'category leadership' positioning most directly colliding with Accenture's GenAI narrative. · Open →
CAP_annual_report_FY2024 — 67 pages · English-language FY2024 financials — firm bookings of €23,821m and regional revenue, a clean comparator to the French FY2025 figures. · Open →
Q4_FY2026 — 14 pages · Wipro FY2026 wrap-up — $10.5bn IT-services revenue, full-year TCV and the $1bn+ Olam engagement. · Open →
What Accenture Is
Accenture sells one thing at enormous scale: the work of turning technology into results for large organizations. It booked $69.7 billion of revenue in fiscal 2025 (year ended August 31), earned a 15.6% adjusted operating margin, converted that into $10.9 billion of free cash flow, and returned $8.3 billion to shareholders — on a balance sheet carrying net cash and a 25% return on equity [1]. Yet the stock has been a five-year laggard, and now trades near 11 times earnings. This chapter explains the business a cold reader needs, and fixes the question the rest of the report answers.
The business in one page
Accenture is a global professional services firm — incorporated in Ireland, run from around the world, listed on the NYSE. Its product is people. As of August 31, 2025 it employed approximately 779,000 people, the majority in India, the Philippines and the United States, and served more than 9,000 clients, including three-quarters of the Fortune Global 500 [2]. Those clients are the Forbes Global 2000 and governments; 195 of its top 200 clients have been with the firm for a decade or more [3].
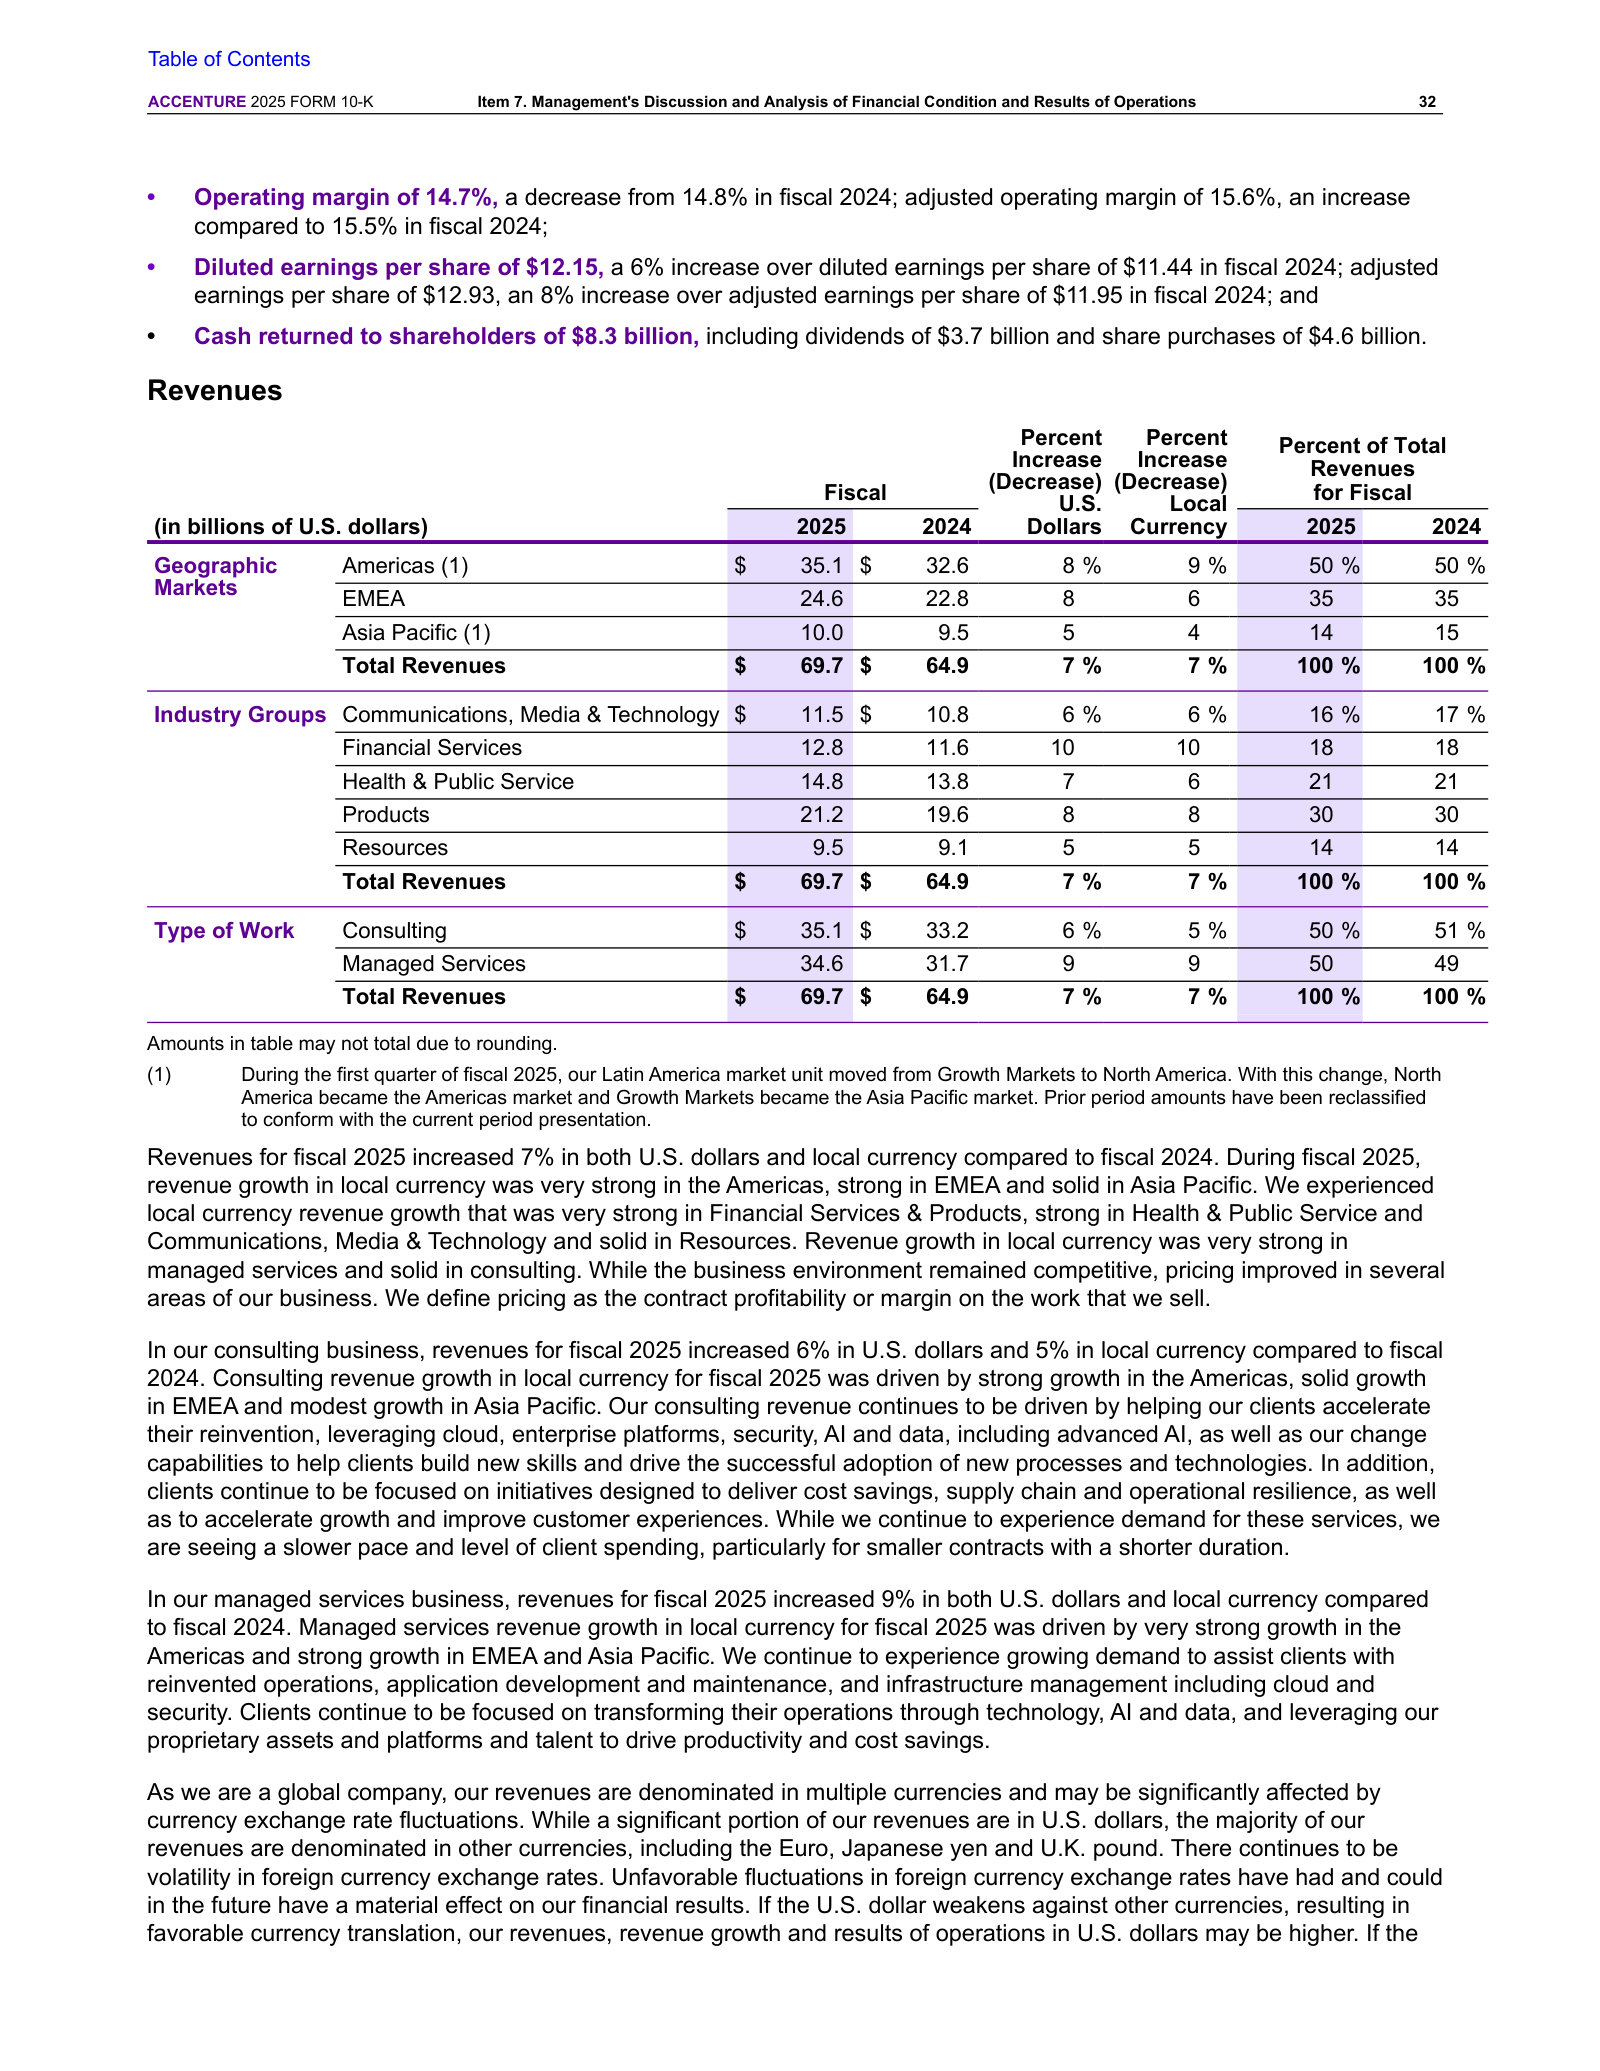
The work spans strategy, consulting, technology, operations, marketing (Song) and engineering (Industry X), sold through five industry groups and delivered across three geographic markets: the Americas (50% of revenue), EMEA (35%) and Asia Pacific (14%) [4]. Two kinds of work sit underneath: Consulting ($35.1 billion in fiscal 2025) — advising and building — and Managed Services ($34.6 billion) — running processes and systems on the client's behalf, a more recurring, annuity-like stream [5].
FY2025 Revenue ($B)
Adj. Operating Margin
Free Cash Flow ($B)
Return on Equity
Source: FY2025 Annual Report (Form 10-K), Key Financial Metrics and reported financials [6].
The economics follow from the model. Capital expenditure is roughly 1% of revenue, so almost all operating cash flow drops through to free cash flow; the firm holds about $11.5 billion of cash against $5.1 billion of debt, leaving it in a net-cash position. The margin is thin by software standards but stable, because the largest cost is compensation and Accenture manages it directly — utilization ran 92% in fiscal 2025 and voluntary attrition 14% [7]. A global delivery network — its largest centers in India and the Philippines — supplies price-competitive labor, the arbitrage that has underwritten margins for two decades [8].
Size, shape and the growth arc
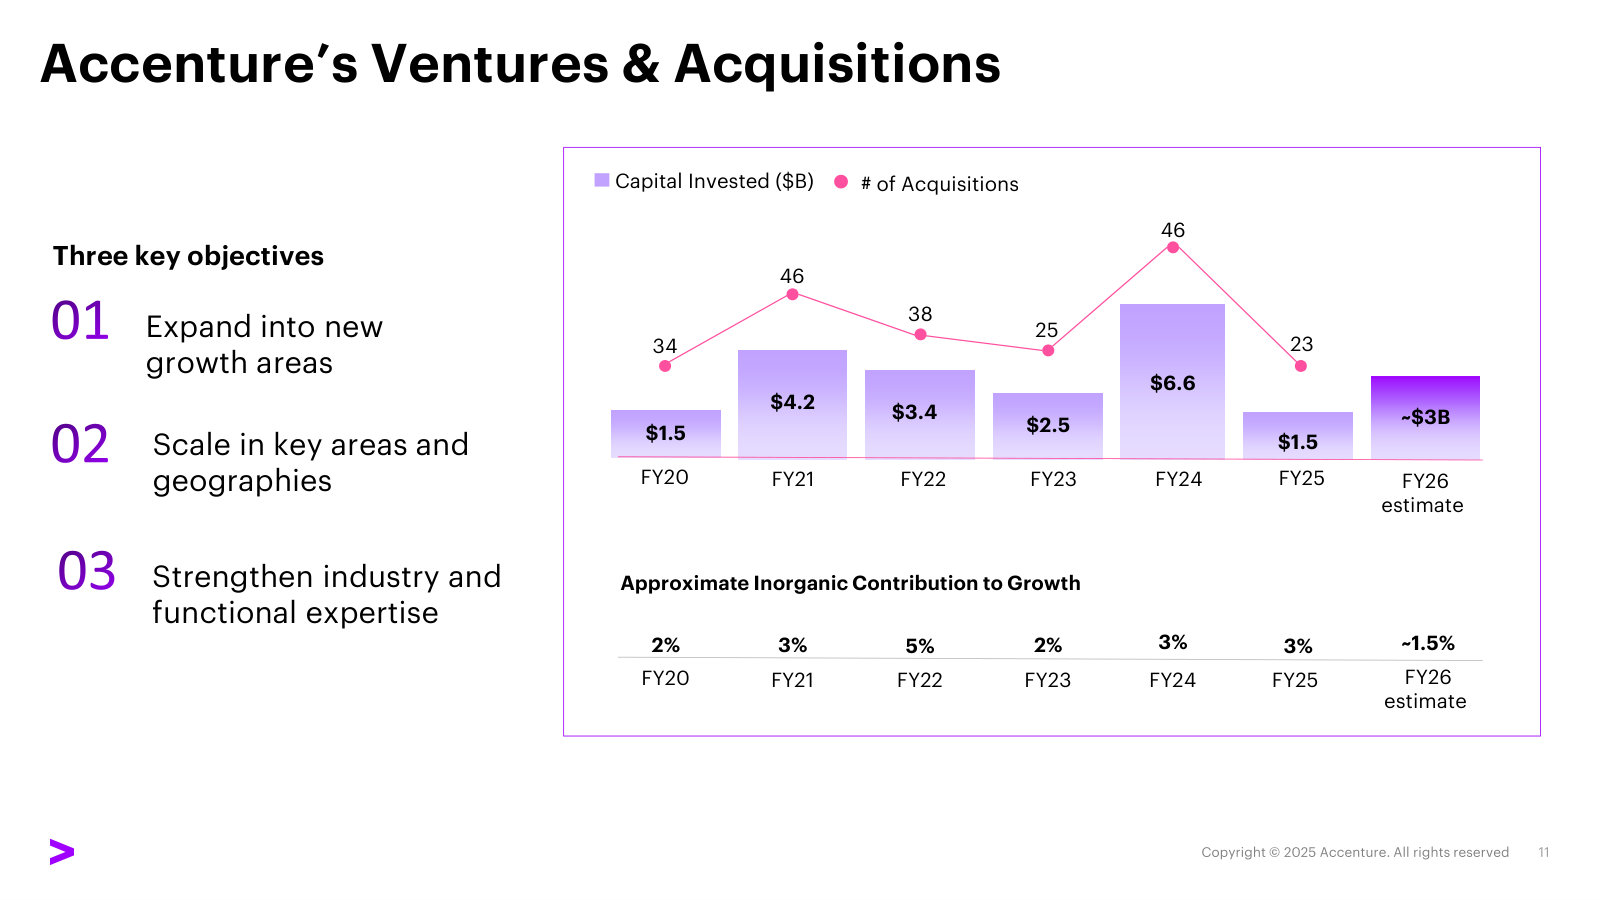
The scale was built by compounding through cycles, accelerated by a steady stream of acquisitions — 23 in fiscal 2025 alone, for $1.5 billion, on top of a decision to invest $3 billion in generative AI [9]. Revenue rose from $44.3 billion in fiscal 2020 to $69.7 billion in fiscal 2025.
Source: FY2022 10-K Consolidated Income Statements (FY2020–FY2022) [10]; FY2025 10-K MD&A (FY2023–FY2025) [11].
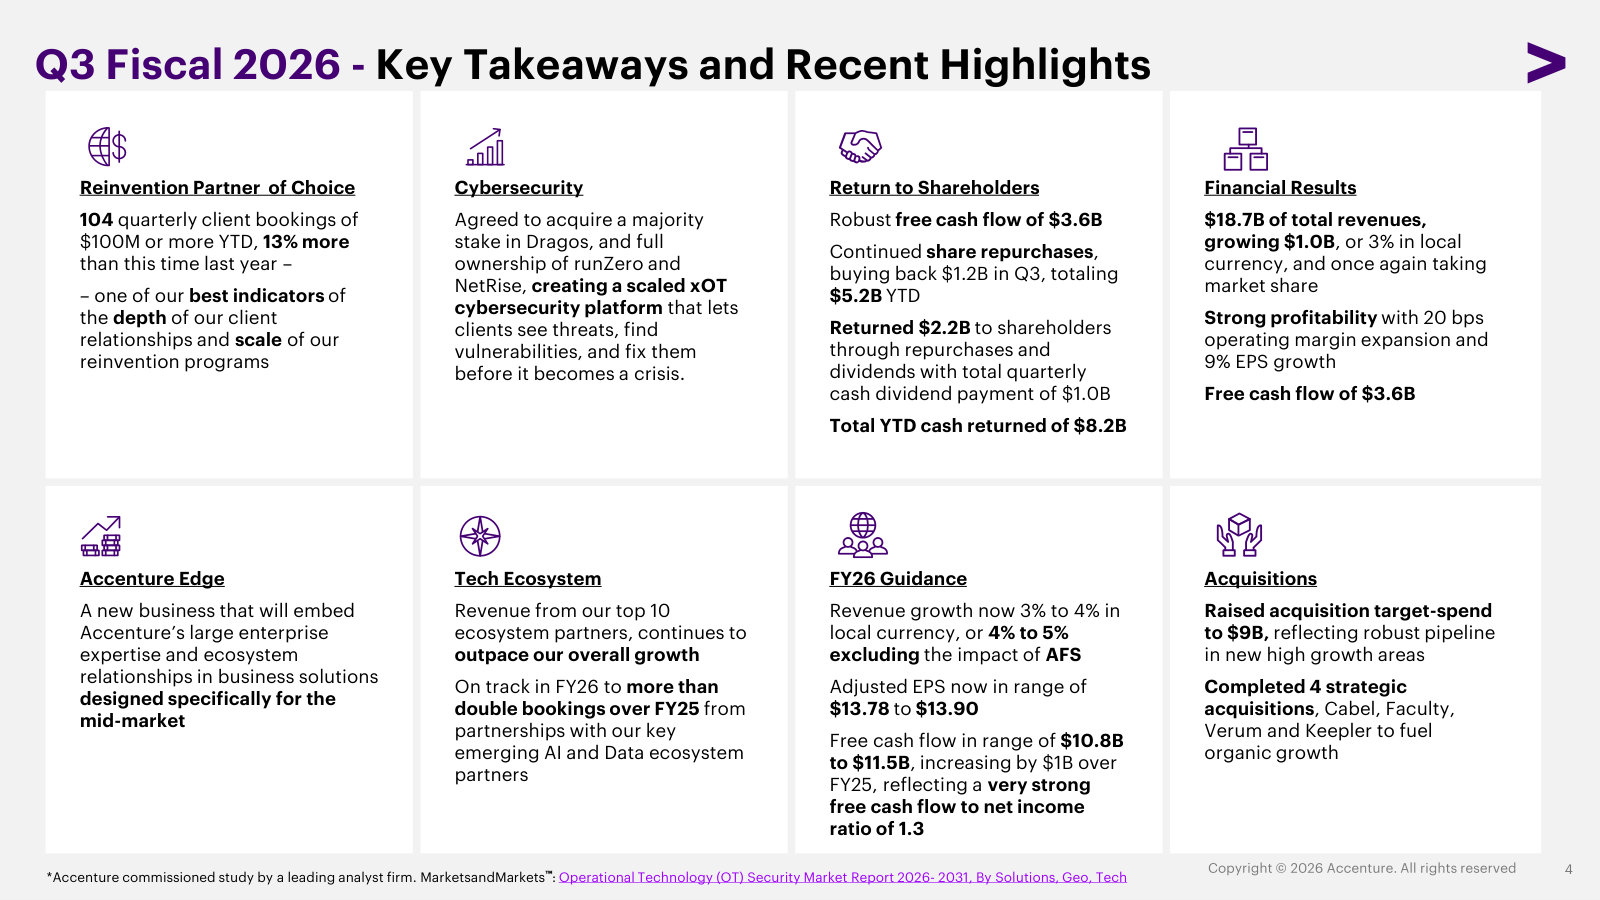
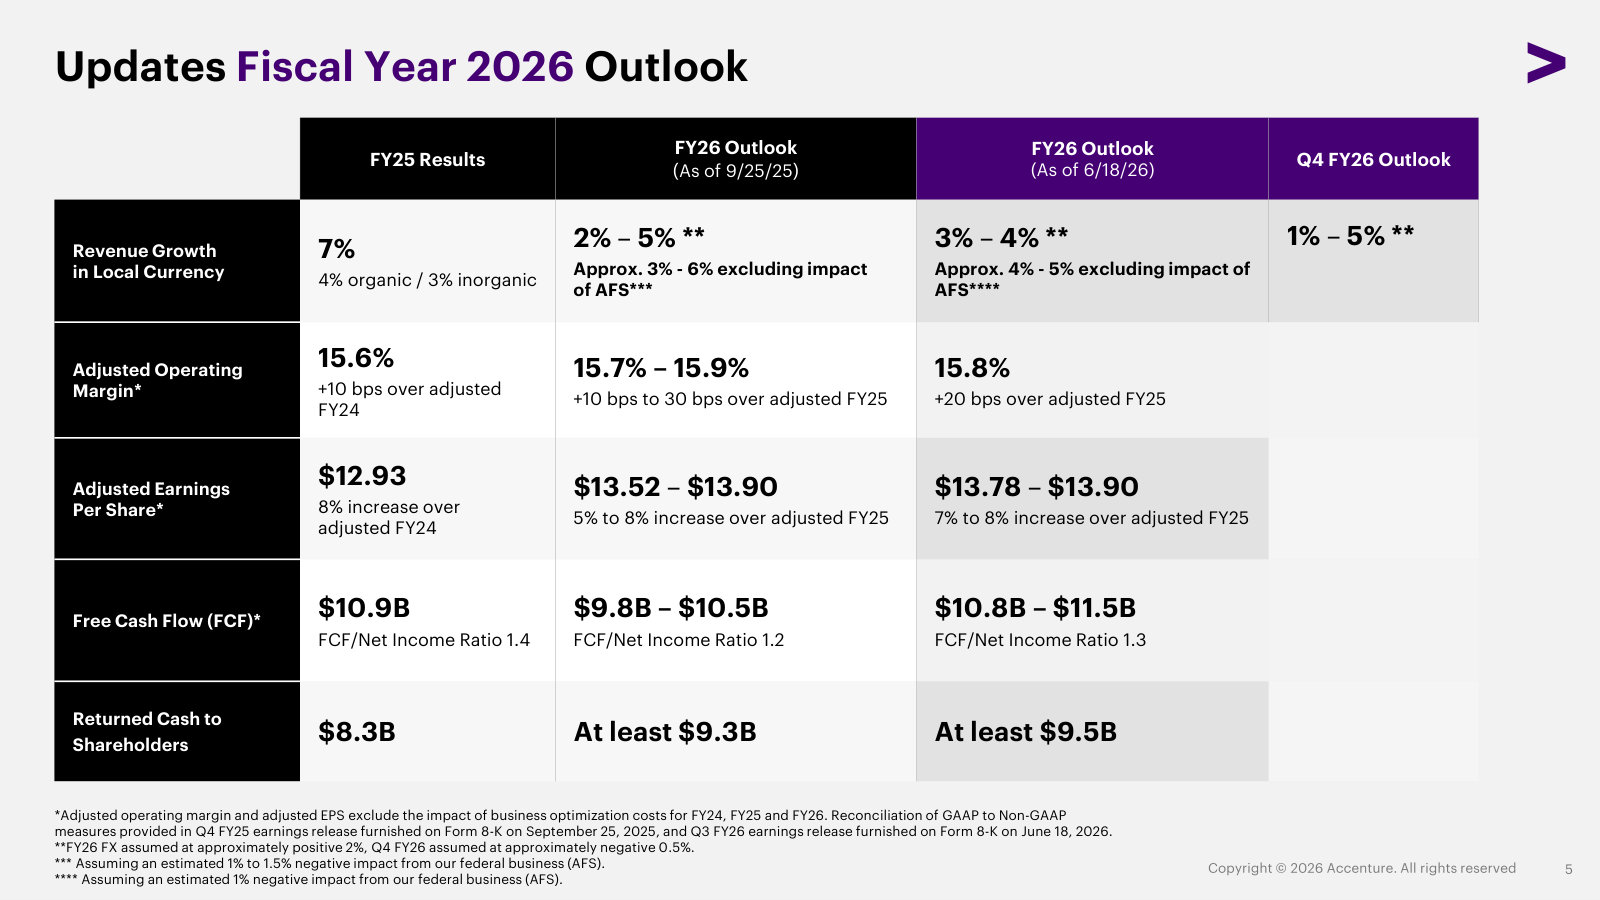
The headline hides the more important story: the pace of growth has swung sharply. Local-currency revenue grew 26% in fiscal 2022 as pandemic-era digital demand peaked [12], then decelerated to 8% in fiscal 2023 [13] and just 2% in fiscal 2024, its slowest year in over a decade [14]. Fiscal 2025 recovered to 7% [15]. For fiscal 2026, management now guides to 3–4% local-currency growth, or 4–5% excluding an estimated one-point drag from a shrinking U.S. federal business [16].
Source: FY2022 10-K [17]; FY2023 10-K [18]; FY2024 [19] and FY2025 10-Ks [20]; Q3 FY2026 release (2026 guidance) [21].
Two things about the current run-rate are worth holding onto. First, demand for large programs is still there — 104 quarterly bookings of $100 million or more in the first three quarters of fiscal 2026, up 13% year on year — even as total new bookings edged lower and book-to-bill held at 1.2 [22]. Second, most of the contracts behind those bookings are cancellable on short notice, so backlog is a softer signal here than in businesses with locked-in multi-year revenue [23].
What the stock has done
For a business this profitable, the share price has been conspicuously weak. Measured on total return with dividends reinvested, $100 invested in Accenture at the end of fiscal 2020 was worth $117 five years later. The same $100 in the S&P 500 became $199, and in the S&P 500 IT sector, $251 [24].
Source: FY2025 Annual Report (Form 10-K), Comparison of Cumulative Total Return [25].
The de-rating has continued into fiscal 2026. At roughly $142 a share, Accenture is valued at about 11.7 times trailing GAAP earnings of $12.15 and 10.6 times the midpoint of its fiscal 2026 guidance — a multiple more often seen on a business in structural decline than on one earning a 25% return on equity. The dividend yields about 4.2%, and consensus carries a mean price target near $179, roughly 26% above the current quote.
Trailing P/E (x)
Dividend Yield
Net Cash ($B)
Consensus Target ($)
Source: reported financials and share price (as of July 7, 2026); consensus estimates. Earnings per share of $12.15 and dividends from FY2025 10-K [26].
The question this report answers
The gap between the quality of the business and the price of the stock is best explained by a single force, which is also the reason the business itself is at an inflection. Accenture sells the implementation of technology; the technology that has arrived is generative and agentic AI, which can write code, run processes and produce analysis — the very tasks that fill its 779,000 timesheets. The same force is, so far, a source of demand: Accenture tripled advanced-AI revenue to $2.7 billion in fiscal 2025 and nearly doubled generative-AI bookings to $5.9 billion, and has built a workforce of about 77,000 AI and data practitioners [27]. It is also, in the company's own risk disclosure, a threat: AI could reduce the volume of work clients need, or compress the pricing of the labor-based delivery that produces most of Accenture's revenue [28].
That tension is the spine of this report. The question is whether generative AI expands Accenture's reinvention franchise faster than it erodes the people-and-scale economics that generate its roughly $70 billion of revenue and $11 billion of annual free cash flow — and whether the low-single-digit growth on offer today is the base of a durable compounder or the new steady state of a maturing one. The chapters that follow each test one side of that question — the durability of the moat, the honesty of the acquisition-fed growth engine, the cash the model actually throws off, and what 11 times earnings implies.
Accenture is a high-quality, cash-generative, net-cash compounder whose stock has lagged the market for five years because growth has normalized from a pandemic peak and because generative AI is, at once, its largest new demand driver and the clearest threat to its labor-based model. The report weighs those two forces against a valuation that already prices in disappointment.
Moat and Disintermediation
Accenture's advantage is scale and entrenchment, not unit economics. At roughly $70 billion of revenue it is two to three times the size of the largest pure-play IT-services firms, has partnered with 195 of its top 200 clients for a decade or more, and is the No. 1 partner to each of its top 10 technology allies. But its net margin trails the offshore-heavy Indian majors, its clients are retained non-exclusively, and its own filings name those same partners as potential disintermediators. The moat is wide on breadth; the AI question sits squarely on top of it.
The scale gap is the first fact
No competitor matches Accenture's combination of size and range. Management's own framing is that "no other company offers the full range of services at scale that Accenture does" [1], and the revenue figures bear out the scale half of that claim: at $69.7 billion in fiscal 2025 [2], Accenture is larger than TCS, Capgemini, Cognizant, Infosys and IBM's consulting arm — in most cases by a factor of two to three.
Sources: Accenture revenue as reported [3]; peer figures per company filings, most recent fiscal year, converted at approximately ₹86/US$ and $1.08/€ — approximate and not fiscal-year aligned. IBM shown as its Consulting segment only.
The breadth claim is the more important one. Accenture serves approximately 9,000 clients, including a significant portion of the Fortune Global 100 and 500, and its five capability areas — strategy and consulting, technology, operations, Song and Industry X — let it sell full-scope transformation programs that the narrower offshore firms cannot assemble alone [4]. Nearly 80% of its large deals are now multi-service [5] — a structural reason those deals are harder for a single-capability rival to displace.
The moat does not show up as superior margins
Scale and breadth do not translate into the best profitability in the peer set, and an honest moat read has to sit with that. Accenture's fiscal 2025 net margin was 11.0% and its return on equity 24.6% — respectable, but below the offshore-heavy Indian majors, whose entirely low-cost delivery base, capital-light balance sheets and near-absence of acquired goodwill produce structurally higher returns.
Source: derived from reported financials, most recent fiscal year; company filings, as reported. IBM excluded — only its diversified group results, not a comparable services margin, are available.
The reading is not that Accenture is weak; it is that its edge is not per-dollar efficiency. TCS and Infosys earn more on every revenue dollar because almost all of their headcount sits in low-cost locations and they carry little goodwill. Accenture runs a heavier, higher-touch, onshore-plus-offshore consulting model — and defends a 15.6% adjusted operating margin, expanded 10 basis points in fiscal 2025 [6], while investing $1.5 billion in acquisitions, $800 million in R&D and $1.0 billion in learning. The moat, if it exists, has to be found in what that model buys: proximity to the client's largest decisions, not the lowest cost of a coding hour.
Entrenchment is real, and measurable
The most durable evidence for the moat is relationship depth. Accenture has partnered with 195 of its top 200 clients for 10 or more years and counts 305 Diamond clients — its largest relationships [7]. Decade-long tenure across nearly the entire top cohort is a switching cost that does not appear on the balance sheet: it is accumulated knowledge of a client's systems, data and industry that a challenger has to rebuild from zero.
That entrenchment sits next to a second signal: management states it "took share at more than five times our investable basket of our closest global publicly traded competitors" in fiscal 2025 — on its own self-defined measure of market share [8]. Share gains at that pace, in a year of only 7% local-currency growth, are among the more telling facts in the bull case for the moat: Accenture is compounding its lead in a slow market, not merely holding it.
Two facts cut the other way, and belong in the same breath. First, the entrenchment metric is not monotonic — Diamond clients slipped from 310 in fiscal 2024 to 305 in fiscal 2025, a small decline in the very cohort that anchors the relationship story [9]. Second, and more structural, clients "typically retain us on a non-exclusive basis" [10]. The switching cost is high but not a lock; a long relationship buys the next conversation, not a contractual monopoly on the client's spend.
Ecosystem primacy is the second pillar
Accenture's position with the large technology platforms is the part of the moat least visible from the outside and, arguably, the hardest to copy. It is the No. 1 partner to all of its top 10 ecosystem partners — among the world's largest technology companies — and 60% of fiscal 2025 revenue came from work tied to those partners, growing 9% and outpacing the company overall [11]. Being the default integrator for the hyperscalers and enterprise-software vendors channels a steady flow of implementation work and puts Accenture in the room when those platforms launch the next wave of products.
Disintermediation by its own partners
The same ecosystem primacy is where the AI threat is sharpest, and Accenture says so itself. Its competition risk factor names the danger plainly: technology companies, "including many of our ecosystem partners and new AI-native companies, are increasingly able to offer services… that require integration services to a lesser extent or replace them in their entirety" [12]. The partners who send Accenture 60% of its revenue are the same firms most able to automate away the integration layer it sells. Alongside them, the filing lists offshore providers in lower-cost locations and clients' own in-house global capability centers as competitors [13] — two forces that GenAI arguably strengthens by lowering the cost of doing the work internally.
Accenture's answer is to move up the value chain faster than the delivery layer commoditizes. It grew its AI and data workforce from 40,000 in fiscal 2023 to approximately 77,000, and has equipped over 550,000 of its people with generative-AI fundamentals — retraining at a scale it treats as a core competency [14]. Whether that reskilling defends the margin or simply relocates the same labor-hours into cheaper AI-assisted delivery is not yet answerable from the filings — it is the open question the rest of this report has to press on.
The measured read: the moat is wide on the dimensions that are established in numbers — scale (2–3x the pure-plays), breadth (80% multi-service deals), relationship tenure (195 of the top 200 for a decade) and ecosystem primacy (No. 1 to all top 10). It is narrower than it looks on the dimensions that matter for the AI case — no per-dollar cost advantage over offshore rivals, non-exclusive retention, and a disclosed risk that its closest partners could disintermediate the work. What would change the read in the bulls' favor is continued share capture at the fiscal-2025 pace paired with stable or rising margins; what would confirm the bears' is a multi-service deal count and Diamond-client cohort that stall while AI-native and in-house alternatives take the integration work. The economics behind that tension — how much of the growth compounding that lead is organic versus bought through acquisition — is where the case goes next.
Where Growth Comes From
Accenture's roughly $70 billion of revenue splits almost evenly between Consulting and Managed Services, across five industry groups and three geographies. The more revealing cut is how much of that growth is organic. Once the ~3-point inorganic contribution and the ~1-point federal drag are stripped out, Accenture's organic ex-federal revenue runs only low-single-digits — flat in fiscal 2024 and roughly 4% in fiscal 2025 — while goodwill has climbed 72% to $22.5 billion and guided fiscal-2026 deal spend has risen to a record ~$9 billion to keep feeding it [1] [2] [3] [4] [5].
The stakes are in how much of the reported growth the acquisitions carry. About half of even the strong fiscal-2025 result — 7% in local currency — was inorganic [6] [7], and the balance-sheet counterpart is a goodwill line that has reached $22.5 billion, about 34% of total assets [8]. The guided ~$9 billion of fiscal-2026 acquisition spend would be the largest in company history [9]. A model that leans harder on acquired revenue to clear a low-single-digit growth number carries more integration and impairment risk per dollar of reported growth.
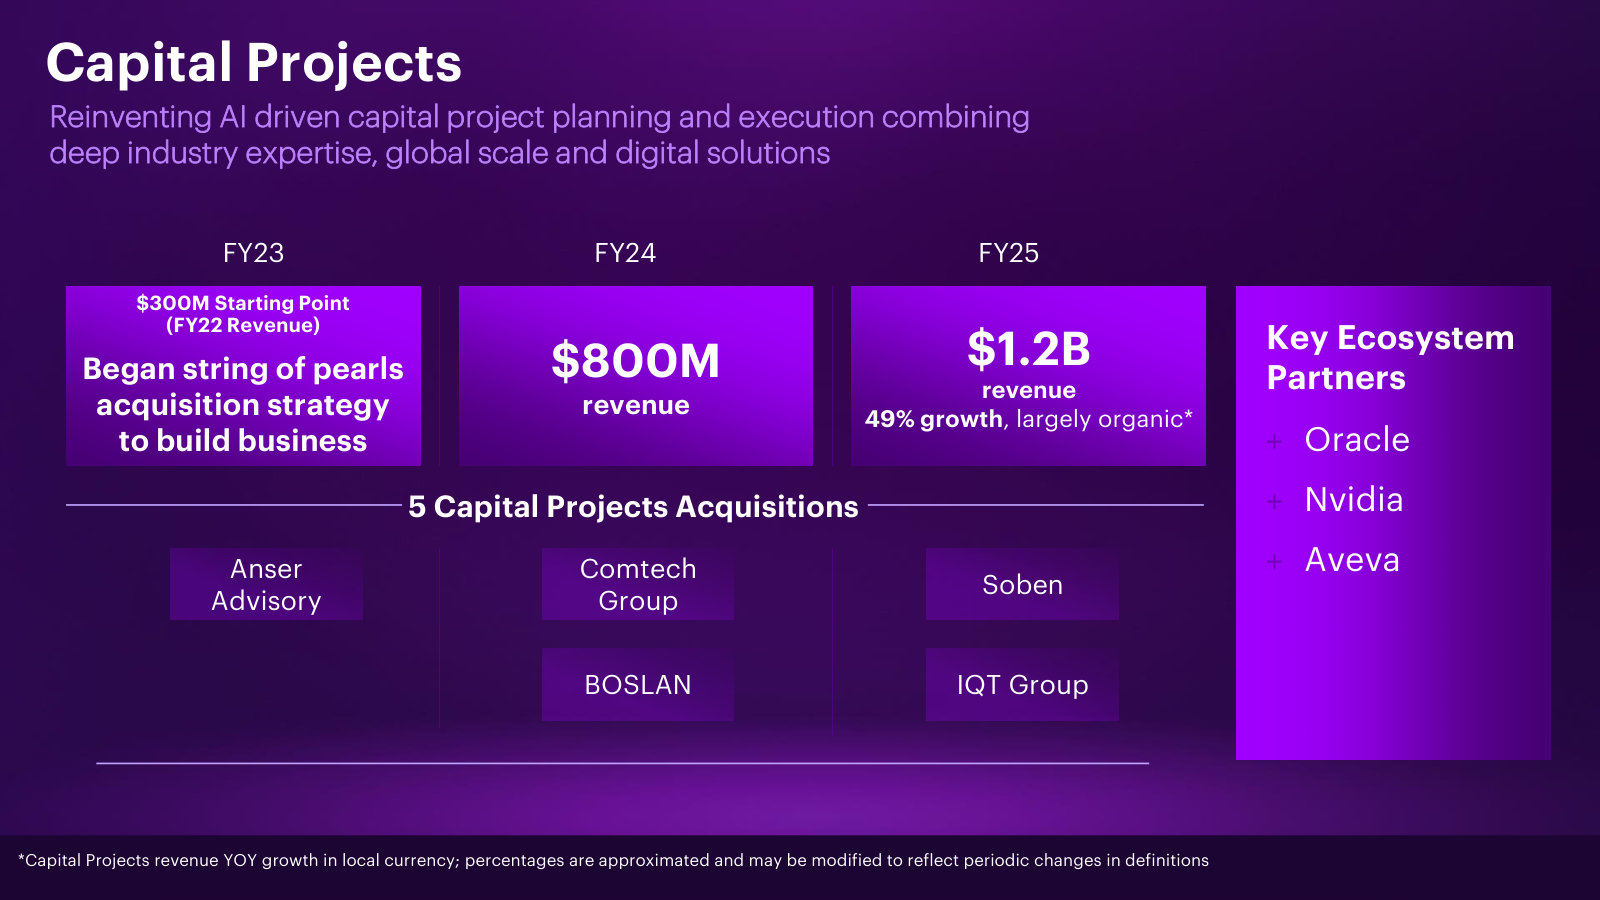
Three facts belong in the same frame and cut the other way. Federal is only about 8% of revenue [10], and ex-federal the base business is already growing 4–5%, with management guiding the federal headwind to anniversary and federal to return to growth in the quarter that ends in August 2026 [11] [12]. The buy-then-grow model has a live proof point: the capital-projects business, assembled through acquisitions, is now a $1.2 billion practice that grew 49% in fiscal 2025 largely organically [13]. And the annual impairment test found no goodwill impairment at either August 2025 or August 2024, each segment's fair value substantially above carrying value [14]. The organic core is thin, but on the disclosed record it has not been eroding, and the acquisitions have so far compounded capability rather than papered over decline.
The composition of that organic growth — which half of the business carries it, and where the current weakness sits — fills out the rest of this chapter.
The two halves: Consulting and Managed Services
Accenture reports revenue by two types of work, and they are now almost the same size. In fiscal 2025 Consulting was $35.1 billion and Managed Services $34.6 billion — a near-even 50/50 split, versus 52/48 two years earlier [15]. The distinction matters because the two behave differently through a cycle. Consulting is project work — much of it under contracts shorter than twelve months that a client can cancel on short notice — while Managed Services runs and operates client systems and functions under multi-year contracts with longer notice periods and early-termination charges.
Source: FY2024 Annual Report, MD&A (FY2023–FY2024) [16]; FY2025 Annual Report, MD&A (FY2025) [17].
The gap in resilience shows in the trough. In fiscal 2024, as the discretionary side stalled — Consulting fell 1% in local currency — Managed Services still grew 5% [18]. By the third quarter of fiscal 2026 Managed Services had overtaken Consulting outright — $9.39 billion versus $9.33 billion in the quarter, growing 5% in local currency against Consulting's 1% [19]. The backlog points the same way: Managed Services new bookings rose 24% in local currency in fiscal 2024 against 3% for Consulting, and because these contracts convert to revenue over several years, they seed a recurring base that carries forward [20]. Managed Services is the steadier, slower-to-turn half of the franchise, and it is now the larger one.
The growth engine rotates
Accenture's five industry groups rarely weaken together. What looks like a smooth deceleration in the headline number is, underneath, a relay in which the drag moves from one group to another while others accelerate.
Source: FY2024 Annual Report, MD&A (FY2024 vs FY2023) [21]; FY2025 Annual Report, MD&A (FY2025) [22]; Q3 FY2026 Earnings Release [23].
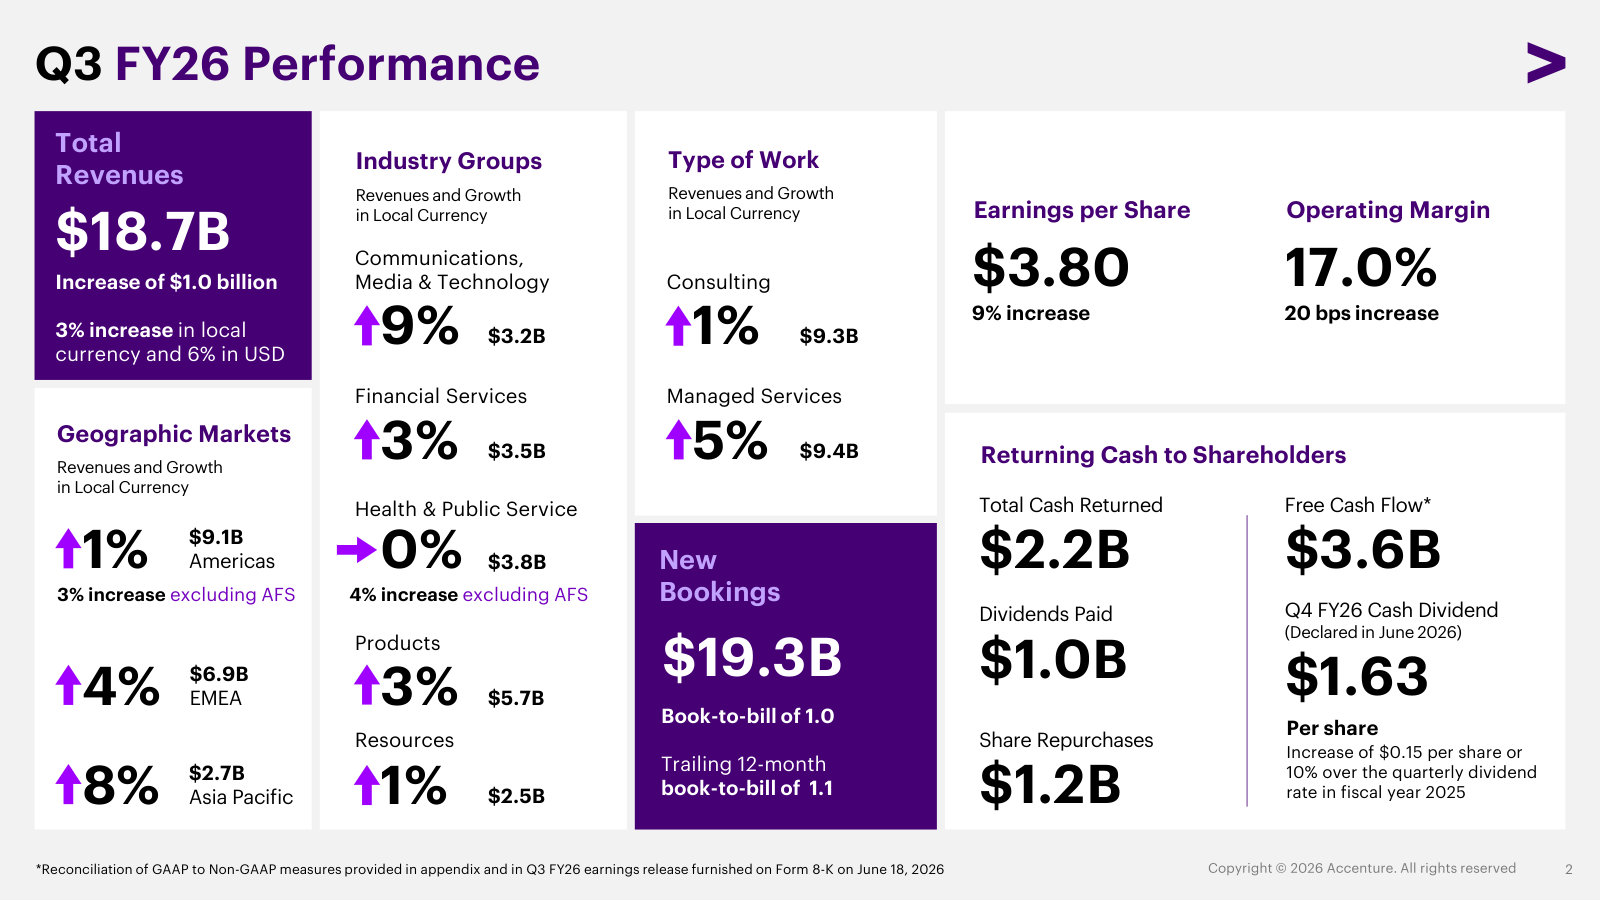
The pattern is close to a mirror image. In fiscal 2024, a technology-spending recession pulled Communications, Media and Technology down 4% and Financial Services down 3%, while Health and Public Service — carried by federal work — grew 10% and held the company up [24]. By the third quarter of fiscal 2026 the roles had swapped: Communications, Media and Technology had recovered to 9% growth in local currency while Health and Public Service had flattened to zero [25]. Products, the largest group at roughly 30% of revenue, held positive growth throughout. This is the diversification argument made concrete: the deceleration to low-single-digit growth happened without any single group collapsing, because the soft spot keeps moving.
The federal pocket
The current weak pocket is specific and named. On the second-quarter fiscal-2025 call, management sized Accenture Federal Services at about 8% of global revenue and 16% of Americas revenue, and disclosed that the General Services Administration had instructed federal agencies to review contracts with the ten highest-paid consulting firms — Accenture among them — and terminate those not deemed mission critical [26]. Slower procurement and contract reviews turned a fiscal-2024 tailwind into a fiscal-2026 drag: Health and Public Service growth in local currency went from 6% for full-year fiscal 2025 to minus 1%, minus 1%, and zero across the first three quarters of fiscal 2026 [27] [28] [29] [30].
Source: FY2025 Annual Report, MD&A (FY2025) [31]; Q1–Q3 FY2026 Earnings Releases [32] [33] [34].
Management quantifies the effect directly, and it is contained. In the third quarter, total revenue grew 3% in local currency; excluding federal it grew about 4% [35]. The concentration is sharper in the Americas, where federal is a larger share: Americas grew 1% in local currency, or roughly 3% excluding federal, versus a roughly 2-point drag one quarter earlier when Americas grew 3% against roughly 6% ex-federal [36] [37].
Sources: Q3 FY2026 transcript [38] [39] [40]; Q2 FY2026 transcript [41].
For the full year, guidance of 3–4% local-currency growth includes an estimated 1-point federal impact, so ex-federal the base business is guided to 4–5%; management expects to anniversary the headwind and return federal to growth in the fourth quarter, whose fiscal year ends in August 2026 [42]. That timing is a forecast, not a result: the same disclosure flags ongoing procurement uncertainty, and the fourth-quarter recovery has not yet printed.
Geography tracks the federal effect
The federal drag also explains most of the geographic picture. In fiscal 2025 the Americas grew 9% in local currency, fastest of the three markets; by the third quarter of fiscal 2026 it had decelerated to 1%, the slowest — the arithmetic of a US-federal-heavy region absorbing the drag [43] [44]. Over the same span Asia Pacific accelerated from 4% to 8% and EMEA held near mid-single digits, so the reporting segment carrying the deceleration is the one where federal sits.
Source: FY2025 Annual Report, MD&A (FY2025) [45]; Q3 FY2026 Earnings Release [46].
Reading the composition
The shape of the slowdown argues more for a maturing, rotating franchise than a broadly fading one. The recurring half — Managed Services — is both the larger and the faster-growing side, and the sharpest single drag is a self-identified 8%-of-revenue pocket that management expects to lap within the fiscal year. On the disclosed numbers, that is a concentrated problem with a defined clock, not diffuse erosion. That bears on whether the low-single-digit growth on offer is a durable base or a maturing plateau (Scenarios and Signals): today's rate is held down by an identifiable, potentially reversing headwind rather than by decay across the book.
The strongest fact against that read is that the weakness is not only federal. Consulting grew just 1% in local currency in the third quarter, and Financial Services and Products both roughly halved their growth from fiscal 2025 (Financial Services from 10% to 3%, Products from 8% to 3%) — softening that has nothing to do with the GSA [47] [48]. The discretionary Consulting side is cooling across the board, and a single strong group (Communications, Media and Technology) is doing much of the lifting. What would decide it is observable quarter by quarter: federal returning to growth in the fourth quarter of fiscal 2026 would confirm the concentrated read, while further deceleration in Products or a roll-over in Managed Services growth would mean the weakness has broadened beyond a single business.
Cash and Compounding
Accenture converts reported profit into cash at a genuinely high rate — free cash flow ran about 1.3 to 1.4 times net income across fiscal 2022–2025 [1]. Two things temper what that cash becomes for a shareholder: roughly $2 billion a year of share-based compensation flatters the cash figure and blunts buybacks, so the diluted share count has fallen only about 1.6% in three years; and a rising share of revenue growth is bought, with goodwill up 72% to $22.5 billion.
The cash is real, and low-capex is why
The starting point is not in dispute. Operating cash flow reached $11.5 billion in fiscal 2025 on capital expenditure of just $600 million — under 1% of the $69.7 billion revenue base — leaving $10.9 billion of free cash flow [2]. A people business needs offices and laptops, not fabs or networks, so nearly all of operating cash flow drops through to free cash flow. Over four years the free-cash-flow-to-net-income ratio has sat comfortably above 1.0, the signature of an asset-light model with favourable working capital.
Source: FY2025 Annual Report, Consolidated Statements of Cash Flows [3]. Net income is total net income including noncontrolling interests, as presented on the cash flow statement.
Two mechanics sit behind the strong conversion, and one deserves a second look. The benign part is working capital: clients pay in advance and against milestones, so deferred revenue rose $707 million and accrued payroll $904 million in fiscal 2025, funding the business rather than draining it [4]. The part to weigh is share-based compensation — $2.1 billion in fiscal 2025, added back to operating cash flow because it is non-cash, yet a real economic cost borne by shareholders through dilution [5]. Netting it out, cash generated without expanding the share base was closer to $8.8 billion than the headline $10.9 billion.
What actually reaches shareholders per share
Accenture returned $8.3 billion to shareholders in fiscal 2025 — $4.6 billion of buybacks and $3.7 billion of dividends [6], [7]. The dividend is unambiguous cash out the door. The buyback is where the per-share arithmetic gets less flattering than the dollar figure suggests.
Across fiscal 2023–2025, Accenture spent about $13.5 billion repurchasing roughly 43 million shares, while issuing roughly 25 million shares to employees under its equity programs [4]. The net effect on the count a shareholder actually owns a slice of: diluted weighted-average shares fell from 642.8 million to 632.4 million — about 1.6% over three years, or roughly half a percent a year [8]. Close to three-fifths of the shares bought back simply replaced shares handed to employees. The buyback is doing more to hold dilution flat than to compound value per share.
FCF, FY2025 ($B)
Diluted Shares, FY2025 (M)
Source: diluted share count from the FY2025 Annual Report income statement; repurchase and issuance detail from the shareholders' equity statement [4], [9].
This is not a criticism of the payout — a ~4% dividend yield and a share count that at least holds flat is a reasonable return of capital. It is a correction to the reflex that a $4.6 billion buyback shrinks the company by $4.6 billion. Most of it is treading water against compensation. The read here is that per-share compounding from repurchases is modest, and the swing factor is the SBC bill: if it kept growing at the mid-single-digit pace of the last three years, buybacks would have to rise just to keep the count from drifting up.
A growing share of growth is bought
The second qualifier concerns how that growth is funded. A widening slice of Accenture's revenue growth is acquired rather than organic — the organic-versus-inorganic decomposition, and what it implies for growth durability, belongs to Where Growth Comes From; the angle here is what those deals cost and what they leave on the balance sheet.
The counterpart is a steadily rising goodwill line. Purchases of businesses ran $2.5 billion in fiscal 2023, $6.6 billion in fiscal 2024, and $1.5 billion across 23 deals in fiscal 2025 [10], [11]. Goodwill has climbed from $13.1 billion in fiscal 2022 to $22.5 billion in fiscal 2025 — about 34% of total assets [12].
Source: FY2025 Annual Report, Consolidated Balance Sheet (goodwill balances, fiscal 2022–2025) [13].
The pace is set to step up again. Guided fiscal 2026 acquisition spend began at $3 billion [14] and, after a move into operational-technology cybersecurity software, was lifted to approximately $9 billion — which would be a record year for capital deployed on deals [15]. A model that leans harder on acquisition to hit a low-single-digit growth number carries more integration and impairment risk per dollar of reported growth, which is the thread that ties this chapter back to whether today's growth is a durable base or a maturing plateau.
The evidence against the caution
Three facts cut the other way, and they are not trivial. First, there has been no goodwill impairment: management's annual test found each segment's fair value substantially above carrying value at both August 2025 and August 2024 [16]. Second, the "buy-then-grow-organically" model has a live proof point: the capital-projects business, assembled through acquisitions, is now a $1.2 billion practice that grew 49% in fiscal 2025 largely organically [17]. Deals that seed a capability the firm then compounds are different in kind from deals that rent revenue. Third, management does prune: the fiscal 2025 business-optimization charge included roughly $271 million of impairments tied to divesting two acquisitions no longer aligned with strategy [18] — a small figure against $22.5 billion of goodwill, and evidence of some discipline rather than accumulation for its own sake.
What would change the read: a goodwill impairment, or a stretch where reported growth stays low while acquisition spend and inorganic contribution climb — the fiscal 2026 ramp to ~$9 billion is the near-term test — would move the balance from "bought growth that compounds" toward "growth bought to fill an organic hole."
A balance sheet that quietly changed
One structural shift belongs in the same frame. For most of its public life Accenture carried effectively no debt. In fiscal 2025 it issued $5.0 billion of senior notes across four maturities from 2027 to 2034 [19]. The company remains net cash — $11.5 billion of cash against about $5.1 billion of total debt [20], [21] — so this is not a leverage story. It is a signal that a business generating $11 billion of free cash flow chose to add fixed-rate debt anyway, giving it dry powder for the larger acquisition programme now underway and for continued capital return without drawing down the cash it prefers to keep offshore. It is worth watching whether the borrowing becomes a habit or stays a one-time top-up.
The composite picture: the cash is real and cheaply produced, but it compounds into per-share value more slowly than the $10.9 billion headline implies — buybacks are substantially anti-dilutionary, and a widening slice of growth is acquired and now sits as goodwill on a balance sheet that has, for the first time, taken on debt to keep the engine fed. Whether that engine keeps converting bought capabilities into organic growth is the same question the moat chapter leaves open, now viewed through cash rather than competition.
What the Price Implies
At $142.14, Accenture trades at about 11.7x trailing and 10.3x forward earnings — roughly a third of the ~30x it commanded through 2021–2024, and below every offshore peer in its own filings. Backed out through a simple discount model, that multiple embeds close to zero perpetual growth in earnings and cash flow. At that level, the price implies low-single-digit growth is the start of a decline rather than a floor.
Share Price (7 Jul 2026)
Trailing P/E
Forward P/E (adj. FY26)
Dividend Yield
SBC-adj. FCF Yield
Sources: price and consensus per market data as of 7 Jul 2026; FY2025 GAAP diluted EPS of $12.15 and cash dividend of $5.92 per share [1]; FY2026 adjusted EPS guidance of $13.78–$13.90 [2]; FCF yield derived from SBC-adjusted free cash flow of ~$8.8B on a ~$89.9B market capitalization.
The forward multiple is unambiguous. Full-year fiscal 2026 GAAP diluted EPS is guided to $13.38–$13.50 and adjusted EPS to $13.78–$13.90 [3]. Against the $142.14 close that is 10.6x on the GAAP midpoint and 10.3x on the adjusted midpoint. On the ~$8.8 billion of free cash flow that survives the $2.1 billion share-based-compensation add-back examined in Cash and Compounding, the free-cash-flow yield is ~9.8%; on the $10.9 billion headline figure it is ~12.1%. Either way, a 25%-return-on-equity, net-cash business is priced at a yield most investors associate with no-growth cyclicals.
A de-rating, not a drawdown
The compression happened in two stages. Through fiscal 2020–2025 the share price simply went nowhere while the market compounded: $100 invested in Accenture on 31 August 2020 was worth $117 five years later, against $199 for the S&P 500 and $251 for the S&P 500 IT sector [4]. The stock peaked in the index at $151 in fiscal 2024 and gave it all back by fiscal 2025.
Source: FY2025 Annual Report, Comparison of Cumulative Total Return [5].
The second stage came after the fiscal year closed. The stock fell roughly 50% across calendar 2026, including a record single-day decline of about 18% on 18 June 2026 — the day Accenture cut full-year revenue-growth guidance to 3–4% in local currency [6], down from the 3–5% range set in March [7], and analysts recast the story around AI disrupting the labor-based model. The multiple, near 37x at its 2021 peak and averaging roughly 26x over the past decade per market data, now sits near 11x — its lowest as a public company. The market has repriced Accenture from a secular grower to a mature services firm.
Priced below its own peer set
The starkest evidence that this is a re-rating rather than a sector move is relative. Accenture is two to three times the size of any pure-play peer and, as Moat and Disintermediation set out, the entrenched leader of the group — yet it trades below the offshore Indian majors on trailing earnings and roughly in line with the two Western pure-plays whose growth has stalled.
Source: derived from each company's latest reported net income and market capitalization per market data. Accenture's FY2025 10-K describes its competitors as large multinational IT service providers and India-based offshore providers [8]; the multinational and offshore majors shown are the standard named comparables. IBM is excluded because its ~27x group multiple reflects a software-heavy mix, not a comparable services business.
This inversion is new. Accenture historically traded at a premium to all of these names, and to the market. Today TCS (15.3x) and Infosys (14.7x) — structurally more profitable per dollar, as Moat and Disintermediation quantified — carry higher multiples, while Cognizant (9.3x) and Capgemini (9.7x), both wrestling with weak growth, anchor the bottom. Accenture sits with the laggards. That is either a mispricing of the franchise leader or the market's judgment that scale no longer confers a premium in an AI-disrupted services market.
What the multiple embeds
Reversing the arithmetic gives the cleanest read on expectations. Treating adjusted EPS as a proxy for distributable cash — reasonable for a business that spends under 1% of revenue on capital — and discounting at a 9% cost of equity, a fair multiple of 1 ÷ (r − g) implies the perpetual growth rate the price is paying for. At $142, the embedded growth is roughly zero; at the $179 consensus target it is about 1–2%; the decade-average 26x multiple embedded around 5%.
Source: derived — fair P/E = 1 ÷ (9% − g), applied to the $13.84 midpoint of FY2026 adjusted EPS guidance [9]. Illustrative; sensitive to the discount rate assumed.
The exercise is a simplification — it assumes a single discount rate and treats adjusted earnings as fully distributable — but the direction is robust across reasonable inputs: at today's price the market is paying for a business whose free cash flow never grows again, and may gently decline. That is a coherent position given the disclosed disintermediation risk, falling bookings (Q3 FY2026 new bookings of $19.3 billion were down 3% in local currency [10]), and the roughly flat organic growth documented in Cash and Compounding. It is also a demanding one: management is guiding to 7–8% adjusted EPS growth for fiscal 2026 [11], and the company still returns roughly $9.5 billion a year to shareholders while holding net cash.
The gap between price and consensus
The evidence points to a stock priced for structural decline in a business still growing earnings and cash. Which reading wins turns on the trajectory of organic bookings and revenue rather than on the multiple itself, and the two paths — the arithmetic bull case that needs no re-rating and the bear case that reads the low multiple as information — are laid out with their monitorable signals in Scenarios and Signals.
For valuation purposes the point is narrower. At roughly 10x forward earnings the price already embeds close to zero perpetual growth, so the ~26% gap to the ~$179 consensus target is best read not as obvious upside but as the market's honest disagreement about which growth regime Accenture is in.
AI and the Labor Model
Accenture's revenue is still, at bottom, people multiplied by utilization multiplied by bill rate. On the disclosed evidence, generative AI is so far expanding that engine faster than it is deflating it: advanced-AI revenue tripled to $2.7 billion at pricing management calls accretive to the blended average [1] [2], and headcount is guided to grow again in fiscal 2026 [3]. The countervailing signals are equally real — gross margin slipped to 31.9%, and an $865 million workforce "rotation" is under way [4] [5].
This is the mechanism the rest of the report leans on. The valuation (What the Price Implies) shows a multiple that embeds roughly zero perpetual growth; the moat (Moat and Disintermediation) rests on a delivery network of nearly 779,000 people. This chapter tests directly what both depend on: whether AI grows the work Accenture sells faster than it shrinks the hours it bills.
The Labor Engine
Accenture converts headcount into revenue at a fairly stable rate. It employed approximately 779,000 people at the end of fiscal 2025 — the majority in India, the Philippines and the U.S. — and ran them at 92% utilization, in a band that has held between 91% and 93% for five years [6] [7]. Because utilization is already near its practical ceiling, revenue growth has historically required proportionate headcount growth — which is exactly what AI threatens to break.
Sources: headcount and utilization from FY2021–FY2025 Annual Reports [8] [9]; revenue per employee derived from reported revenue and period-end headcount.
The two most recent years tell the story in miniature. In fiscal 2024, headcount rose 5.6% to 774,000 while revenue grew barely 1% in dollars — revenue per employee fell to about $83,800. In fiscal 2025 the pattern inverted: headcount was essentially flat, up 0.6%, while revenue grew more than 7% and revenue per employee jumped to about $89,400 [10] [11]. A single year of flat headcount against 7% growth is the first visible sign of AI decoupling revenue from bodies. It is also, on management's own account, partly a correction of fiscal 2024 over-hiring rather than a structural break: the same executives guide headcount to grow across all three markets in fiscal 2026 [12].
Source: derived from reported revenue and period-end headcount, FY2021–FY2025 Annual Reports [13].
Where AI Shows Up in Revenue
Advanced AI is entering the top line as new demand. Accenture tripled advanced-AI revenue — generative, agentic and physical AI — to $2.7 billion in fiscal 2025 and nearly doubled generative-AI bookings to $5.9 billion, from a base where a year earlier it had "roughly 30 people working on a handful of Gen AI projects with negligible revenue" [14] [15].
Source: FY2025 earnings materials; FY2024 figures implied by management's "tripled" revenue and "nearly doubled" bookings framing [16].
Two features of that $2.7 billion matter more than its size. First, its pricing is accretive: asked directly how generative-AI projects are priced, management said "we do see pricing that is accretive overall to average" [17]. That is the opposite of the commoditization the bear case assumes, at least while the work is scarce and hard to scale.
Second, and easy to miss, the figure excludes AI used in delivery. Management is explicit that the advanced-AI number reflects only revenue and bookings for AI Accenture sells to clients, and does "not include data, classical AI or AI used in delivery of our services" [18]. The productivity Accenture extracts by embedding AI into its own delivery — through platforms it names, GenWizard and AI Refinery — never appears in the revenue line at all [19]. If it creates value, that value has to surface as margin. So the delivery-side effect of AI — the part that most directly deflates billed hours — is invisible in the top line and testable only in the cost structure.
The Margin Test
The cost structure does not yet show AI expanding delivery economics. Cost of services rose to 68.1% of revenue in fiscal 2025 from 67.4%, so gross margin fell to 31.9% from 32.6% — a decline the filing attributes "primarily to higher payroll costs" [20]. Even after adjusting out the workforce charge, operating margin expanded only 10 basis points on the year [21].
Source: derived from reported revenue and cost of services, FY2022–FY2025 filings [22].
That is the clearest restraint on the bull mechanism. Whatever hours GenWizard and AI Refinery are automating in delivery, the savings are either being competed away in pricing, reinvested into higher-skilled (and higher-paid) staff, or not yet large enough to move a $47 billion cost line. Rising payroll cost per dollar of revenue is consistent with a workforce shifting toward scarcer AI and data skills faster than automation is removing lower-cost hours. Delivery-side AI is, so far, a promise in the cost base rather than a realized margin gain.
Reshaping the Workforce
Accenture is managing the labor transition through what it calls a "refreshed three-pronged talent strategy": upskilling as the primary path; "exiting people in a compressed timeline where reskilling is not a viable path for the skills we need"; and driving operating efficiencies, including through AI [23]. The third leg is voluntary reshaping; the second is not. In the fourth quarter of fiscal 2025 it launched a six-month business-optimization program, recording a $615 million charge and guiding to roughly $865 million in total — severance tied to "headcount reductions that we are making in a compressed timeline," alongside the divestiture of two acquisitions no longer aligned with strategy [24] [25].
The scale of the retraining effort is the other half of the response. Accenture grew its AI and data workforce from 40,000 in fiscal 2023 to roughly 77,000, trained more than 550,000 people in generative-AI fundamentals, and invested about $1.0 billion in learning across fiscal 2025 [26] [27].
The distinction that matters for the investment case: this is reshaping, not shrinkage. A firm bracing for AI to destroy its labor model would be guiding headcount down. Accenture is doing the opposite — cutting where skills are stranded while guiding total headcount to grow in fiscal 2026 [28]. The $865 million charge is best read as the cost of rotating a workforce, not of retiring one.
How the Bull and Bear Mechanisms Run
The demand-expansion case has concrete support in the client examples management walks through. For one financial-services client of more than a decade, embedding AI across the enterprise — from the contact center to the trading floor — has, for Accenture, "meaningfully expanded the amount of work we do," with the contract value more than doubling over five years [29]. The pattern management asserts is that AI automates a client's process, and the reinvention required to get there expands the client relationship. Its own framing is two-sided: AI strategy "has to focus on both growth and productivity," and CEOs have "pivoted way too far toward productivity and not enough to growth" [30].
The bear mechanism runs through the same facts. Utilization near its ceiling and flat fiscal-2025 headcount mean incremental revenue increasingly has to come from price and productivity, not more bodies — and gross margin fell rather than rose. The demand that expanded the energy relationship is the client automating work; the day a similar agent removes a layer of billable implementation hours faster than a new reinvention program replaces them, revenue contracts rather than expands. That the entire market for advanced AI is still counted in single-digit billions against a $69.7 billion base means the accretive-pricing signal is drawn from a small, early sample.
The disclosed evidence points to AI as net expansionary for Accenture so far: advanced-AI revenue is priced above the blended average, client relationships are widening around it, and headcount is guided to grow. The strongest fact against that read is that fiscal-2025 gross margin fell to 31.9% on higher payroll costs, so delivery-side AI productivity is not yet reaching the bottom line. What would change the read is the revenue-per-employee and gross-margin trajectory over the next several quarters, and whether headcount growth resumes as guided or stalls.
The through-line asks whether AI expands the franchise faster than it erodes the people-and-scale economics. Two years into the transition, the top line and the headcount guide point to expansion, while the margin line shows the erosion is real and not yet offset. Both can be true at once — which is why the resolution shows up not in any single quarter's revenue, but in whether revenue per employee keeps rising while gross margin stops falling.
Margin Structure
Advanced-AI revenue tripled to $2.7 billion at accretive pricing yet excludes AI used in delivery, and in fiscal 2025 gross margin fell 70 basis points to 31.9% on higher payroll while adjusted operating margin still rose 10 basis points to 15.6% purely on sales-and-admin scale leverage — so the productivity half of the AI story is nowhere in the margin the labor-and-AI economics would move [1] [2] [3]. Accenture's roughly 15.6% adjusted operating margin is the net of two opposing forces: contract-level gross margin — the labor economics of billing a person out for more than they cost to deliver — is flat-to-eroding, while the operating line grinds about 10 basis points higher a year because scale lets sales and administrative costs fall faster than gross margin slips. That decomposition is where the labor model and AI reach the income statement first.
Adjusted Operating Margin (FY2025)
Gross Margin (FY2025)
Gross Margin Change (FY2025)
Sources: FY2025 Annual Report (Form 10-K), MD&A — Operating Expenses [4]; Non-GAAP Operating Margin [5].
The stakes sit in what a continued slide costs. Seventy basis points on $69.7 billion of revenue is roughly $490 million of gross profit, and the offset that covered it in fiscal 2025 — about 90 basis points of sales-and-administrative leverage — is finite: once overhead has been compressed as far as scale allows, a second year of gross-margin erosion flows through to operating income [6]. The counter-fact sits in the same record: gross margin also fell to 32.0% in fiscal 2022 with no AI involved and recovered to 32.6% by fiscal 2024, so a single 70-basis-point year sits within historical variation rather than proving structural decay [7] [8].
The fiscal-2025 bridge
Fiscal 2025 is the clearest illustration. Cost of services rose to 68.1% of revenue from 67.4% — the 70-basis-point gross-margin decline — while sales and marketing fell to 10.1% from 10.6% and general and administrative cost fell to 6.2% from 6.6% [9]. The filing names the same driver on both sides of the ledger: gross margin fell on "higher payroll costs," and both overhead lines fell on "lower payroll and non-payroll costs" [10]. Payroll got more expensive inside delivery and cheaper inside the corporate structure in the same year.
Sources: FY2025 Annual Report (Form 10-K), MD&A — Operating Expenses [11]; Non-GAAP Operating Margin [12].
The 70-basis-point gross-margin decline was more than covered by 90 basis points of overhead leverage. What kept reported operating margin from expanding was a third line: business optimization costs rose to 0.9% of revenue from 0.7% — a $615 million charge including $344 million for an accelerated talent rotation and $271 million of impairments on two divested Americas acquisitions [13]. Those charges are what separate the 14.7% GAAP line from the 15.6% adjusted line, and they are the reason the adjusted figure — which is what incentive pay is measured against (Management's Record) — expanded 10 basis points while the GAAP figure slipped 10.
Where the operating margin comes from
Two margins move in opposite directions. Gross margin — revenue less cost of services — has held in a narrow 31.9% to 32.6% band for five years, and in fiscal 2025 it fell to the bottom of that range, down 70 basis points from 32.6%, which the company attributes to higher payroll costs [14]. Adjusted operating margin, by contrast, has climbed in each of the last five years — 15.1%, 15.2%, 15.4%, 15.5%, 15.6% — the steady 10-to-30-basis-point cadence management commits to and reliably delivers (Management's Record) [15] [16] [17].
Source: derived from reported MD&A, FY2021–FY2025 Annual Reports (Forms 10-K) [18] [19] [20] [21] [22].
The gap between the two lines is the work that scale does. Gross margin captures the economics of the roughly 779,000 people who deliver the work; the distance from gross margin down to the operating line is sales and marketing plus general and administrative cost, spread across a revenue base that has grown from $50 billion in fiscal 2021 to $69.7 billion in fiscal 2025. As long as that base grows, fixed and semi-fixed overhead falls as a share of revenue, and the operating line can rise even when the contract-level margin does not.
Where the labor model shows up first
The mechanism worth tracking sits in gross margin, not in the smooth adjusted line above it. Gross margin is where two of the report's central questions net out: whether generative AI lowers delivery cost faster than it compresses bill rates, and whether wage inflation in a 779,000-person workforce outruns pricing. In fiscal 2025 the answer was negative by 70 basis points — payroll rose faster than realized rates, and AI in delivery has not yet shown up as a cost saving that reaches the margin (AI and the Labor Model).
The strongest fact against reading that as a trend is the history on the chart above: gross margin fell in fiscal 2022 (32.4% to 32.0%) and then recovered over the next two years, so a single 70-basis-point year is inside the range of normal variation, not evidence of structural decay [23]. The read that fits the evidence: gross margin is the leading indicator of the labor-and-AI economics, it has softened once, and it takes a second and third year of erosion — with overhead leverage exhausted — before the operating line itself would have to fall. What would settle it is gross margin either stabilizing back toward 32.5% as AI reaches delivery cost, or drifting lower a second year while the adjusted operating margin stops climbing.
Margins by geography
The segment note adds a second layer: the same business earns materially different margins across its three geographic markets, and the spread tracks payroll intensity almost exactly.
Source: FY2025 Annual Report (Form 10-K), Segment Reporting note [24].
Asia Pacific runs the highest operating margin, 18.2%, on the lowest payroll ratio, 62.3% of revenue; EMEA runs the lowest margin, 12.5%, on the highest payroll ratio, 68.4%; the Americas sit between the two [25]. Because Accenture bills its global delivery network into each client geography through intercompany charges, these are margins on client relationships, not on where the work is performed — so the ranking reflects the pricing and cost mix of serving each region's clients rather than a simple offshore-versus-onshore split.
The mix matters two ways. The highest-margin geography is also the smallest — Asia Pacific is $10.0 billion of the $69.7 billion total — and, per Where Growth Comes From, the fastest-growing, so continued Asia Pacific outperformance is a modest margin tailwind. Working the other way, the Americas GAAP margin dipped to 15.2% from 15.6% in fiscal 2025, but that was the business-optimization charge landing there: $420 million of the $615 million total hit the Americas, and excluding it the region's margin rose to about 16.4% from 15.9% [26]. Underneath the charge, all three regions expanded margin over the fiscal 2023–2025 window.
A lower margin, by design
For all the steadiness of the climb, 15.6% is a modest operating margin for the scale leader of its industry. The offshore-centric Indian majors earn operating margins several points higher on far smaller revenue bases — the structural feature of an onshore, consulting-led, Western-cost model examined in Moat and Disintermediation. Accenture trades margin percentage for breadth, entrenchment, and absolute scale: a lower rate applied to $69.7 billion of revenue still produced $10.2 billion of operating income and $10.9 billion of free cash flow (Cash and Compounding) [27]. What matters here is the direction of the margin, not its level: the operating line has compounded upward for five years on scale leverage, and that engine keeps running only while revenue grows. In the low-single-digit growth environment the rest of this report examines, a declining gross margin leaves less overhead leverage available to offset it, so the contract-level line tracks whether the economics are improving or deteriorating more directly than the adjusted headline does.
Management's Record
Accenture's management delivers reliably on the two things it controls most directly — operating margin and cash returned to shareholders — and less reliably on the one it does not: revenue. It cut fiscal-2024 revenue guidance three times, cut fiscal-2026 guidance again in June 2026, whipsawed hiring and acquisition spending, and has recorded "business optimization" charges in three consecutive years that are excluded from the adjusted numbers its own pay is measured against. Set against that, executive pay has fallen as the stock lagged — a real alignment offset.
This chapter tests whether the management behind a maturing $70 billion franchise can be trusted to execute the reshaping and allocate a rising deal budget as organic growth stays in the low single digits.
What they hit, and what they missed
The cleanest read on management credibility is the gap between what it guides at the start of a year and what it delivers. On margin, the record is close to metronomic: each year since fiscal 2022 Accenture guided a 10-to-30-basis-point expansion in adjusted operating margin and delivered it, almost always at the low end — 15.6% in fiscal 2025, up 10 basis points [1].
On revenue, the record is not metronomic. Fiscal 2024 opened with guidance of 2–5% local-currency growth [2], was cut to 1–3% by the second quarter [3], cut again to 1.5–2.5% by the third [4], and landed at 2%. Fiscal 2025 was the mirror image — a rare upward revision, from an opening 3–6% [5] to 6–7% [6], delivered at 7%. Fiscal 2026 has already followed the fiscal-2024 pattern: an opening 2–5% [7] cut to 3–4% in June 2026 [8].
Sources: fiscal-2024 guidance path [9][10][11]; fiscal-2025 [12][13]; fiscal-2026 [14][15].
The pattern is that Accenture forecasts its own cost base well and its clients' spending poorly. That is not unique to this management, and demand is genuinely outside its control. But the two guidance cuts in three years fall on the softer side of the through-line: the question is whether 3–4% is a floor, and a team that has twice mis-set the opening number is not yet the reason to believe it is.
The whipsaw
The clearest evidence that management misjudged demand is what it did with people. Accenture added roughly 24,000 net people in fiscal 2024 [16], a year that delivered 2% growth, then in the fourth quarter of fiscal 2025 launched a business-optimization program carrying about $865 million of cost — $615 million booked immediately and roughly $250 million more expected in the first quarter of fiscal 2026 — including severance for "headcount reductions we are making in a compressed timeline" [17]. Having cut, management then guided total headcount to grow again across all three markets in fiscal 2026. Hire into a slowdown, pay to unwind it, rehire — the sequence is expensive and it is management's own.
The acquisition budget swings just as hard. Deal spend ran $6.6 billion across 46 acquisitions in fiscal 2024 [18], collapsed to $1.5 billion across 23 in fiscal 2025 [19], and is now guided to about $9 billion in fiscal 2026 on the back of the announced operational-technology cybersecurity deals [20] — a swing of roughly six-fold in two years, with the largest budget landing in the lowest-organic-growth year of the cycle.
Sources: fiscal-2023 to fiscal-2025 capital deployment per earnings calls [21][22][23]; fiscal-2026 return guidance $9.3B [24] and deal guidance ~$9B [25]; earlier years from company filings, as reported.
The M&A results carry both a proof point and a scar. On the positive side, management can point to its capital-projects business — assembled through acquisitions — now a $1.2 billion operation that grew 49% in fiscal 2025 "largely organically" [26], evidence that the stated strategy of buying capability to "fuel organic growth" [27] sometimes works as advertised. On the negative side, part of the fiscal-2025 charge was a $271 million asset impairment tied to divesting two Americas acquisitions "that are no longer aligned with our strategic priorities" [28] — capability bought and then written down. With goodwill now $22.5 billion and no segment impairment recorded [29], the fiscal-2026 deal ramp is the batting-average test that matters most, and the filings disclose spend and goodwill but never deal-level returns — the honest limit on how far this can be scored from the outside. The cumulative-vs-organic split behind this spend is dissected in Cash and Compounding.
The adjusted numbers, and what pay is measured on
The recurring line in that whipsaw is "business optimization costs" — and where it lands in the accounts is a genuine governance question. Accenture has now recorded these charges three years running: $1,063 million in fiscal 2023 (1.7% of revenue) [30], $438 million in fiscal 2024, and $615 million in fiscal 2025 [31], with more guided for fiscal 2026. Each year, the headline adjusted numbers exclude them. The gap is not trivial: in fiscal 2025 the charges cut GAAP operating margin by 90 basis points, so reported margin of 14.7% became an adjusted 15.6% [32], and adjusted diluted EPS of $12.93 sat $0.78 above the GAAP $12.15 [33]. In fiscal 2023 the wedge was wider still — a 170-basis-point gap between GAAP's 13.7% and adjusted's 15.4% [34].
Source: FY2025 Annual Report, non-GAAP reconciliation (fiscal 2024–2025) [35]; FY2023 Annual Report non-GAAP reconciliation [36].
This matters because the adjusted figures are close to what pay tracks. Accenture's global annual bonus is funded against a Company earnings target, and its largest equity element — the Key Executive Performance Share Program — vests on operating-income results and relative total shareholder return over three years [37]. The proxy's own results narrative presents earnings on the adjusted basis, spelling out the $0.51 and $1.28 per share of business-optimization costs removed from fiscal 2024 and fiscal 2023 EPS [38], and its pay-versus-performance disclosure names "Operating Income" as the company-selected measure at $10,034 million — the fiscal-2024 figure that already excludes the charge [39]. A cost that recurs every year, is described as a one-time optimization, and is stripped from the metric that funds incentive pay is the item a skeptic flags first.
The fair rebuttal is that the alignment is working in the other direction, too. Reported CEO compensation has fallen with the business — Julie Sweet's total dropped from $33.7 million in fiscal 2022 to $31.6 million in fiscal 2023 to $24.9 million in fiscal 2024 [40]. Compensation actually paid was lower still, at $19.7 million for fiscal 2024, against a backdrop where $100 invested in Accenture returned $151 while the peer group returned $205 [41]. Because the performance-share awards carry a three-year relative-TSR gate and the stock has lagged, those awards are tracking between threshold and target rather than paying out full [42]. The market-based half of the plan is doing its job even as the operating-income half leans on the adjusted number.
CEO Total Comp (FY2024)
Comp Actually Paid (FY2024)
CEO-to-Median Pay Ratio (x:1)
Source: 2024 Proxy Statement — Summary Compensation Table [43], Pay Versus Performance [44], and CEO Pay Ratio (1,127:1 unadjusted; 420:1 after a cost-of-living adjustment, median employee in India) [45]. Fiscal-2025 proxy figures are not in the source corpus; figures shown are fiscal 2024.
Governance sits on the same fence. The board is 9 of 10 independent with an independent lead director, but Sweet holds the combined chair-and-CEO role [46], so the counterweight to the CEO is an independent lead director rather than an independent chair — a structure that concentrates authority in the person whose forecasts have twice been walked back.
Where this leaves the trust question
The evidence points to a management team that is disciplined with cost and capital return and less sure-footed on demand and workforce planning. The strongest fact for the bull is that pay has genuinely followed the stock down and the buy-to-compound M&A model has at least one large proof point; the strongest fact against is the repeat guidance cuts, the reversal from a hiring surge to abrupt cuts, and a recurring "optimization" charge excluded from the numbers pay is set on. What would change the read is straightforward and checkable: fiscal 2026 revenue holding the 3–4% guide without a further cut, the roughly $9 billion of fiscal-2026 acquisitions closing without a fresh impairment, and the business-optimization line finally going to zero rather than recurring a fourth year. On the present record, the franchise is a firmer basis for the durable-compounder case than management's execution on demand and workforce planning.
Where the report lands
Six chapters converged on two variables: whether Accenture's roughly 3% organic local-currency growth holds, and whether AI reaches margin before it deflates the billable-hours engine. This chapter reconciles them into three fiscal-2029 paths, and the paths share an asymmetry. Because Accenture already trades near the multiple a decliner would command, the base path earns a double-digit return on 7-8% guided EPS growth and the dividend without any re-rating, and the bear case needs organic growth to turn negative rather than merely slow. At $142 the market applies about 10x forward earnings — a near-decline multiple — to a business still guiding 7-8% adjusted-EPS growth [1].
From the fiscal-2026 adjusted-EPS base, the base path — roughly 3% organic growth with margin holding — reaches about $203 by fiscal 2029 at a 12x exit, close to a +56% total return once dividends are counted; the bear path — roughly 0% organic — reaches about $130 at 9x, near +4%. The current ~10x forward multiple already sits close to the 9x bear exit, so the base clears a double-digit annual total return with no re-rating while the bear requires organic growth to go negative. The strongest fact on the other side sits in the same filings: third-quarter bookings fell 3% in local currency, guidance has been cut twice this cycle, gross margin drifted to 31.9% from 32.6%, and the five-year total shareholder return of $117 against the S&P 500's $199 shows the pessimistic path is where the stock has actually traded.
The report has already priced each piece: the moat is real but not the margin edge (Moat and Disintermediation); the $10.9B free cash flow is genuine but compounds slowly per share (Cash and Compounding); the multiple embeds roughly zero perpetual growth (What the Price Implies); AI is expanding the top line faster than it is deflating it, but the productivity is not yet in margin (AI and the Labor Model); and management forecasts its cost base well and its clients' spending poorly (Management's Record). What follows joins them into outcomes rather than re-arguing any one.
What drives the range
The five tensions resolve to two measurable inputs. The first is organic local-currency growth — the growth left after stripping out the ~2-3 points of acquired revenue and the ~2% currency tailwind. Management guides fiscal 2026 to 3-4% in local currency (4-5% excluding the U.S. federal drag) [2], but new bookings fell 3% in local currency in the third quarter even as the count of $100M-plus reinvention deals rose 13% [3]. The second is whether AI reaches the bottom line: advanced-AI revenue tripled to $2.7B at pricing management calls accretive [4], yet fiscal-2025 gross margin slipped to 31.9% from 32.6% on higher payroll costs [5].
Everything else in the report — the buyback that only holds the share count flat, the recurring "business optimization" charges, the $9B fiscal-2026 deal ramp — either amplifies or cushions those two inputs. It does not replace them.
Three paths to fiscal 2029
The table below carries each path from the fiscal-2026 adjusted-EPS base (guidance midpoint $13.84 [6], consensus $13.86) to fiscal 2029, three years out. The exit multiple is the largest single swing: it is set here below Accenture's ~26x decade-average multiple in every case, reflecting a franchise the market now prices as mature.
Source: derived. Base year fiscal-2026 adjusted-EPS guidance midpoint $13.84 and dividend/capital-return inputs per Q3 FY2026 results [7]; starting price $142.14 (7 Jul 2026). Total return adds roughly $18-20 of cumulative dividends over three years at the current ~4.2% yield.
Source: derived scenarios (above); current price $142.14 and consensus mean target $179 per analyst estimates, 7 Jul 2026.
The starting point matters as much as the destination. Because the current multiple is already near the bear's exit multiple, the base path does not need a re-rating to work — it clears roughly a double-digit annual return on EPS compounding plus the dividend, with any multiple recovery as upside. A two-point change in the exit multiple moves the base price by about $34, so the reader can slide the outcome without changing the earnings view. The bear case is not a large drawdown but a flat half-decade: earnings barely grow, the multiple compresses toward the offshore laggards, and the ~4% dividend does most of the work.
Source: derived from the fiscal-2026 adjusted-EPS guidance midpoint of $13.84 [8] and fiscal-2025 adjusted EPS of $12.93 [9], compounded at each path's assumed rate.
Reconciling the evidence
Each row below is a fact the report established, read two ways, with the observable that would settle it. The disagreement is never about the numbers — it is about which direction they travel next.
Sources: bookings and deal count [10][11]; advanced-AI revenue [12] and gross margin [13]; free cash flow and SBC add-back [14]; business-optimization charge [15]. Detailed derivations in the linked chapters.
What to watch
The scenarios are only useful if a reader can tell, quarter by quarter, which one is unfolding. Each signal below is a specific line in a specific filing with a threshold that moves the read.
Source: derived from the decisive metrics identified across this report, each keyed to a disclosed line item in Accenture's filings.
Where the evidence leans
On the evidence gathered here, the base path is the most defensible reading, and the price offers more protection than the headline growth rate suggests. Accenture is still guiding to 7-8% adjusted-EPS growth [16], returning at least $9.5B a year, and taking share while it decelerates; at ~10x forward earnings a buyer is paid a ~4% dividend to wait and needs only mid-single-digit compounding to earn a double-digit return. That is why the sell-side, with zero sell ratings and a $179 mean target, treats the discount as an overshoot.
The strongest fact against that read sits in the same filings: third-quarter bookings fell 3% in local currency [17], management has cut revenue guidance twice this cycle, and the gross margin is drifting down while the productivity case for AI remains a promise rather than a printed number [18]. Bookings are a leading indicator; if they keep falling, the base case's 3% organic growth becomes the bull case, and the bear path — flat earnings, a single-digit multiple, dividend-only returns — is where the stock has actually traded over the last year, its five-year total return of $117 against the S&P 500's $199 [19] a reminder that the pessimistic path is not hypothetical.
What would change the read in either direction is narrow and observable: two or three quarters of book-to-bill above 1.1 with organic growth firming would confirm the base and open the bull; a book-to-bill that stays below 1.0 while the gross margin slips under 31% would confirm that AI is deflating the model faster than it is expanding it. Both dials are reported every ninety days, which makes this a case a patient investor can monitor rather than predict.